备注
Go to the end 下载完整的示例代码.
使用约束布局调整轴的大小#
约束布局尝试调整 figure 中子图的大小,以便轴对象和轴上的标签之间没有重叠.
有关更多详细信息,请参见 约束布局指南 ,有关替代方案,请参见 Tight layout guide .
import matplotlib.pyplot as plt


def example_plot(ax):
    ax.plot([1, 2])
    ax.set_xlabel('x-label', fontsize=12)
    ax.set_ylabel('y-label', fontsize=12)
    ax.set_title('Title', fontsize=14)
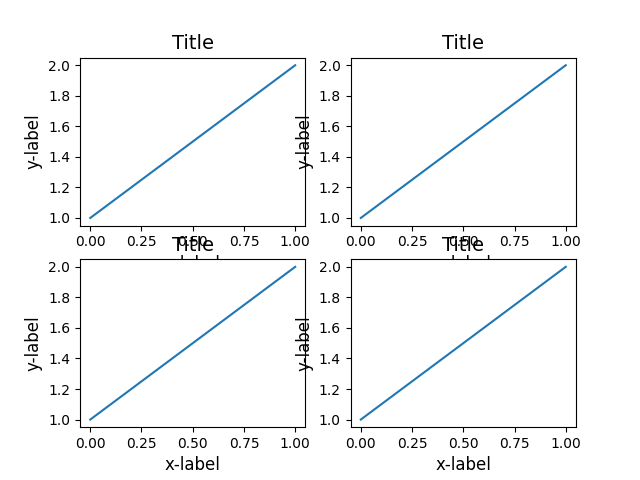
如果我们不使用约束布局,则标签会与坐标轴重叠
fig, axs = plt.subplots(nrows=2, ncols=2, layout=None)

for ax in axs.flat:
    example_plot(ax)
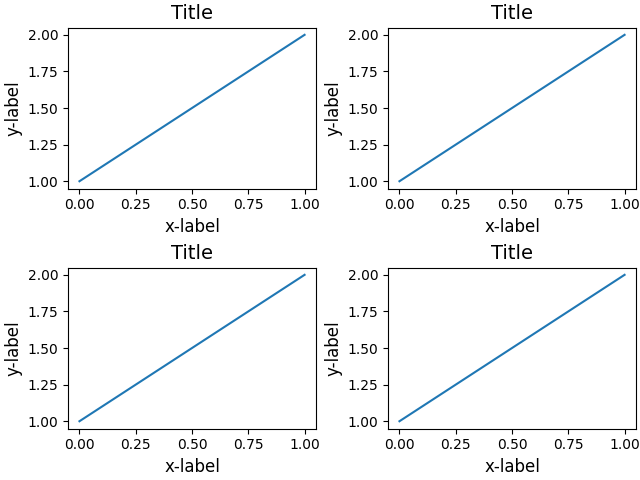
添加 layout='constrained' 会自动调整.
fig, axs = plt.subplots(nrows=2, ncols=2, layout='constrained')

for ax in axs.flat:
    example_plot(ax)
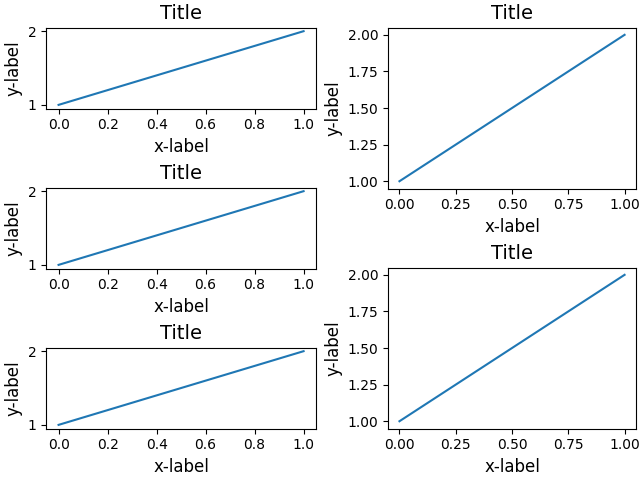
下面是一个使用嵌套 gridspec 的更复杂的例子.
fig = plt.figure(layout='constrained')

import matplotlib.gridspec as gridspec

gs0 = gridspec.GridSpec(1, 2, figure=fig)

gs1 = gridspec.GridSpecFromSubplotSpec(3, 1, subplot_spec=gs0[0])
for n in range(3):
    ax = fig.add_subplot(gs1[n])
    example_plot(ax)


gs2 = gridspec.GridSpecFromSubplotSpec(2, 1, subplot_spec=gs0[1])
for n in range(2):
    ax = fig.add_subplot(gs2[n])
    example_plot(ax)

plt.show()
参考
以下函数,方法,类和模块的用法在本例中显示:
matplotlib.gridspec.GridSpecmatplotlib.gridspec.GridSpecFromSubplotSpec
脚本的总运行时间:(0 分 2.233 秒)