备注
Go to the end 下载完整的示例代码.
使用子图和 GridSpec 组合两个子图#
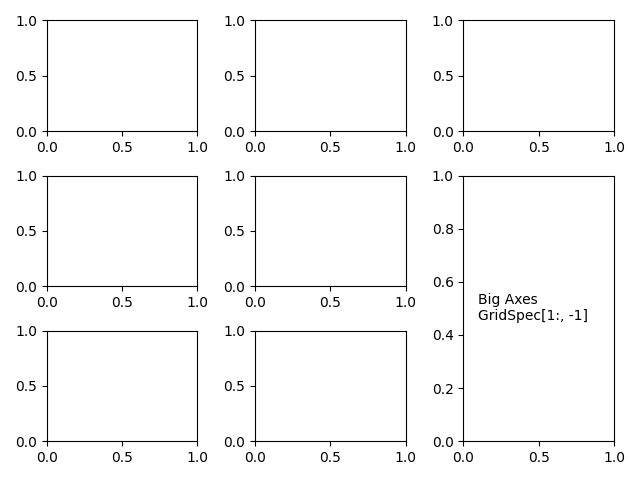
有时我们想在使用 subplots 创建的 Axes 布局中组合两个子图.我们可以从 Axes 获取 GridSpec ,然后删除覆盖的 Axes 并用一个更大的新 Axes 填充间隙.这里我们创建一个布局,其中最后一列的底部两个 Axes 组合在一起.
要从此布局开始(而不是删除重叠的 Axes),请使用 subplot_mosaic .
另请参见 在 Figure 中排列多个 Axes .
import matplotlib.pyplot as plt

fig, axs = plt.subplots(ncols=3, nrows=3)
gs = axs[1, 2].get_gridspec()
# remove the underlying Axes
for ax in axs[1:, -1]:
    ax.remove()
axbig = fig.add_subplot(gs[1:, -1])
axbig.annotate('Big Axes \nGridSpec[1:, -1]', (0.1, 0.5),
               xycoords='axes fraction', va='center')

fig.tight_layout()

plt.show()