备注
Go to the end 下载完整的示例代码.
约束布局指南#
使用约束布局来整洁地将绘图放置在您的图形中.
约束布局自动调整子图,以便刻度标签,图例和颜色条等装饰不会重叠,同时仍保留用户请求的逻辑布局.
约束布局类似于 Tight layout , 但更加灵活.它可以处理放置在多个 Axes 上的颜色条 ( 放置颜色条 ),嵌套布局 ( subfigures ) 以及跨行或列的 Axes ( subplot_mosaic ),并努力对齐同一行或列中 Axes 的脊柱.此外, Compressed layout 将尝试将固定纵横比的 Axes 靠得更近.本文档将介绍这些功能,以及在最后讨论的一些 implementation details .
约束布局通常需要在将任何 Axes 添加到图形之前激活.有两种方法可以做到这一点:
使用
subplots,figure,subplot_mosaic的相应参数,例如:plt.subplots(layout="constrained")
通过 rcParams 激活它,例如:
plt.rcParams['figure.constrained_layout.use'] = True
这些将在以下各节中详细介绍.
警告
调用 tight_layout 将关闭约束布局!
简单示例#
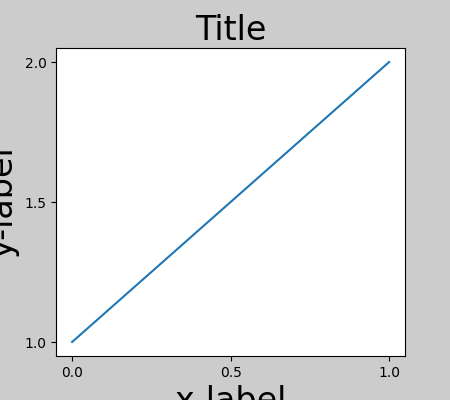
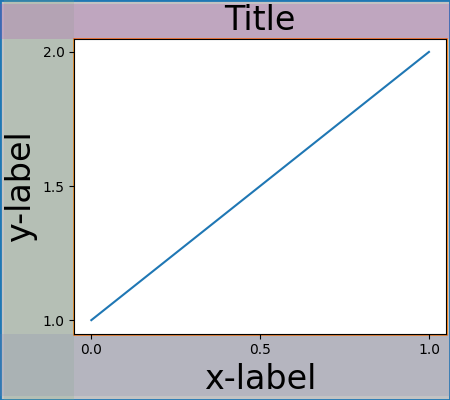
使用默认的 Axes 定位,坐标轴标题,轴标签或刻度标签有时会超出图形区域,因此会被裁剪.
import matplotlib.pyplot as plt
import numpy as np

import matplotlib.colors as mcolors
import matplotlib.gridspec as gridspec

plt.rcParams['savefig.facecolor'] = "0.8"
plt.rcParams['figure.figsize'] = 4.5, 4.
plt.rcParams['figure.max_open_warning'] = 50


def example_plot(ax, fontsize=12, hide_labels=False):
    ax.plot([1, 2])

    ax.locator_params(nbins=3)
    if hide_labels:
        ax.set_xticklabels([])
        ax.set_yticklabels([])
    else:
        ax.set_xlabel('x-label', fontsize=fontsize)
        ax.set_ylabel('y-label', fontsize=fontsize)
        ax.set_title('Title', fontsize=fontsize)

fig, ax = plt.subplots(layout=None)
example_plot(ax, fontsize=24)
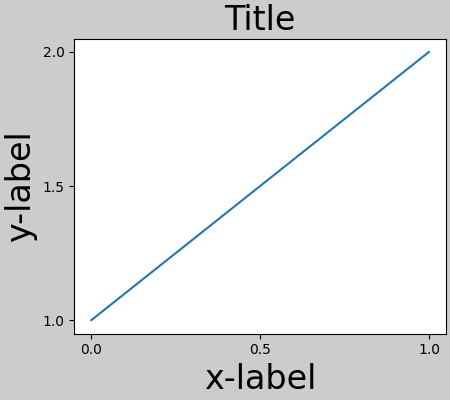
为了防止这种情况,需要调整 Axes 的位置.对于子图,可以通过使用 Figure.subplots_adjust 调整子图参数来手动完成.但是,使用 layout="constrained" 关键字参数指定您的图形将自动进行调整.
fig, ax = plt.subplots(layout="constrained")
example_plot(ax, fontsize=24)
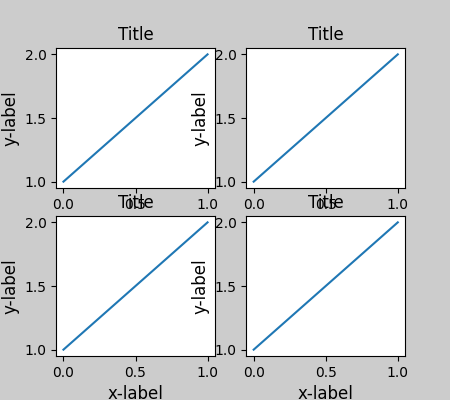
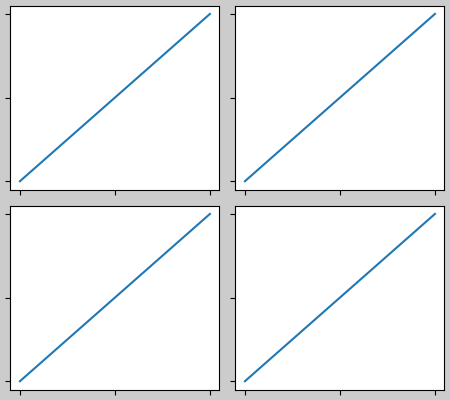
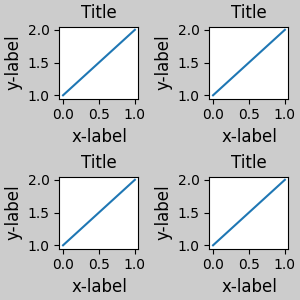
当您有多个子图时,通常会看到不同 Axes 的标签相互重叠.
fig, axs = plt.subplots(2, 2, layout=None)
for ax in axs.flat:
    example_plot(ax)
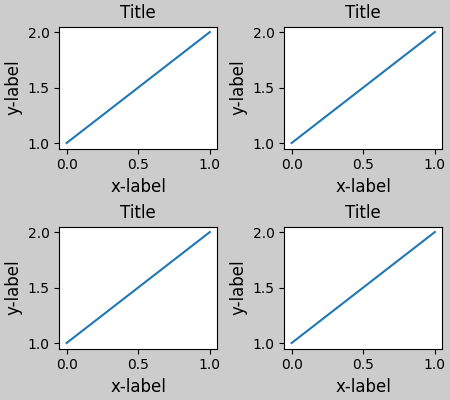
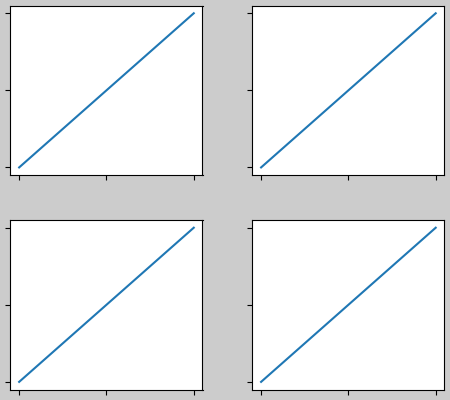
在调用 plt.subplots 时指定 layout="constrained" 会使布局得到适当的约束.
fig, axs = plt.subplots(2, 2, layout="constrained")
for ax in axs.flat:
    example_plot(ax)
颜色条#
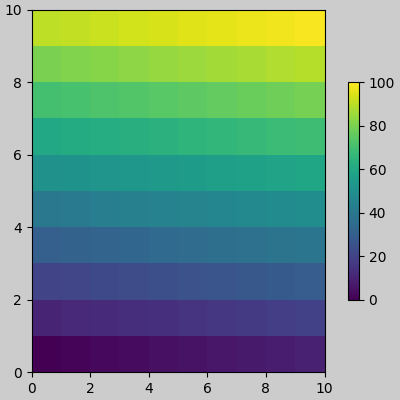
如果您使用 Figure.colorbar 创建颜色条,则需要为其留出空间.约束布局会自动执行此操作.请注意,如果您指定 use_gridspec=True ,它将被忽略,因为此选项旨在通过 tight_layout 改善布局.
备注
对于 pcolormesh 关键字参数 ( pc_kwargs ),我们使用字典来保持整个文档调用的一致性.
arr = np.arange(100).reshape((10, 10))
norm = mcolors.Normalize(vmin=0., vmax=100.)
# see note above: this makes all pcolormesh calls consistent:
pc_kwargs = {'rasterized': True, 'cmap': 'viridis', 'norm': norm}
fig, ax = plt.subplots(figsize=(4, 4), layout="constrained")
im = ax.pcolormesh(arr, **pc_kwargs)
fig.colorbar(im, ax=ax, shrink=0.6)
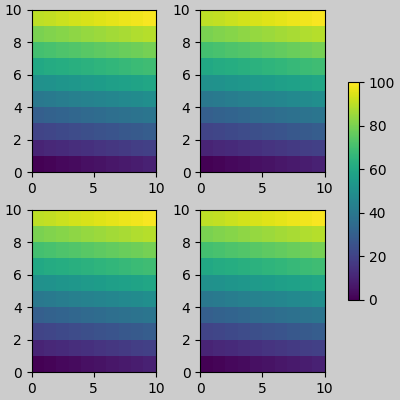
如果您为 colorbar 的 ax 参数指定 Axes 列表(或其他可迭代容器),约束布局将从指定的 Axes 中占用空间.
fig, axs = plt.subplots(2, 2, figsize=(4, 4), layout="constrained")
for ax in axs.flat:
    im = ax.pcolormesh(arr, **pc_kwargs)
fig.colorbar(im, ax=axs, shrink=0.6)
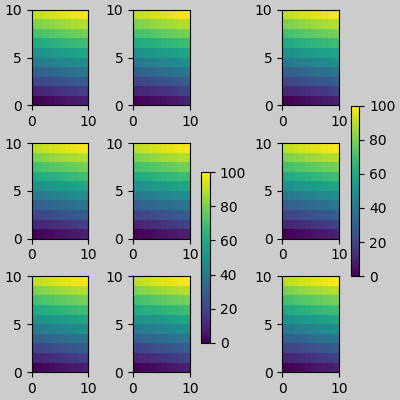
如果您从 Axes 网格中指定一个 Axes 列表,颜色条将适当地占用空间,并留下一个间隙,但所有子图的大小仍将相同.
fig, axs = plt.subplots(3, 3, figsize=(4, 4), layout="constrained")
for ax in axs.flat:
    im = ax.pcolormesh(arr, **pc_kwargs)
fig.colorbar(im, ax=axs[1:, 1], shrink=0.8)
fig.colorbar(im, ax=axs[:, -1], shrink=0.6)
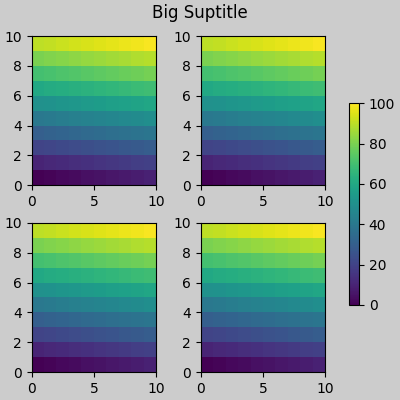
总标题#
约束布局还可以为 suptitle 留出空间.
fig, axs = plt.subplots(2, 2, figsize=(4, 4), layout="constrained")
for ax in axs.flat:
    im = ax.pcolormesh(arr, **pc_kwargs)
fig.colorbar(im, ax=axs, shrink=0.6)
fig.suptitle('Big Suptitle')
图例#
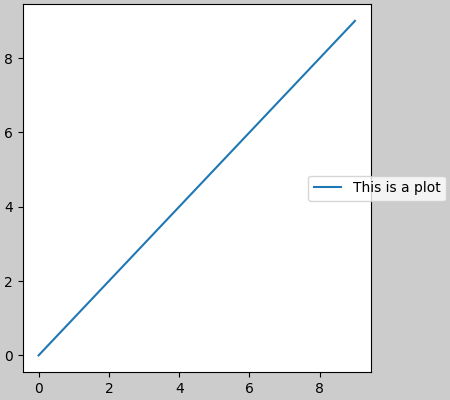
图例可以放置在其父轴之外.约束布局旨在为 Axes.legend() 处理此问题.但是,约束布局尚不能处理通过 Figure.legend() 创建的图例.
fig, ax = plt.subplots(layout="constrained")
ax.plot(np.arange(10), label='This is a plot')
ax.legend(loc='center left', bbox_to_anchor=(0.8, 0.5))
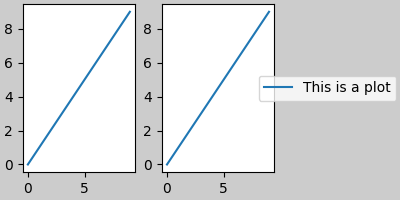
但是,这会占用子图布局的空间:
fig, axs = plt.subplots(1, 2, figsize=(4, 2), layout="constrained")
axs[0].plot(np.arange(10))
axs[1].plot(np.arange(10), label='This is a plot')
axs[1].legend(loc='center left', bbox_to_anchor=(0.8, 0.5))
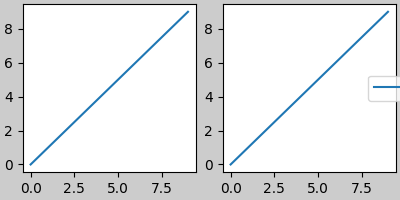
为了使图例或其他 artist 不占用子图布局的空间,我们可以 leg.set_in_layout(False) .当然,这可能意味着图例最终会被裁剪,但如果随后使用 fig.savefig('outname.png', bbox_inches='tight') 调用该图,则可能会很有用.但是,请注意,必须再次切换图例的 get_in_layout 状态才能使保存的文件正常工作,并且如果我们希望约束布局在打印之前调整 Axes 的大小,则必须手动触发绘图.
fig, axs = plt.subplots(1, 2, figsize=(4, 2), layout="constrained")

axs[0].plot(np.arange(10))
axs[1].plot(np.arange(10), label='This is a plot')
leg = axs[1].legend(loc='center left', bbox_to_anchor=(0.8, 0.5))
leg.set_in_layout(False)
# trigger a draw so that constrained layout is executed once
# before we turn it off when printing....
fig.canvas.draw()
# we want the legend included in the bbox_inches='tight' calcs.
leg.set_in_layout(True)
# we don't want the layout to change at this point.
fig.set_layout_engine('none')
try:
    fig.savefig('../../../doc/_static/constrained_layout_1b.png',
                bbox_inches='tight', dpi=100)
except FileNotFoundError:
    # this allows the script to keep going if run interactively and
    # the directory above doesn't exist
    pass

保存的文件如下所示:

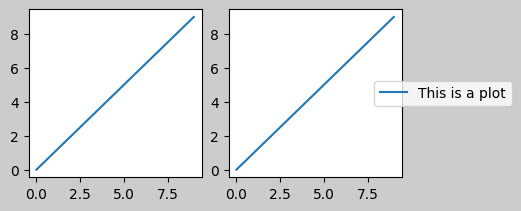
解决这种笨拙的更好方法是简单地使用 Figure.legend 提供的图例方法:
fig, axs = plt.subplots(1, 2, figsize=(4, 2), layout="constrained")
axs[0].plot(np.arange(10))
lines = axs[1].plot(np.arange(10), label='This is a plot')
labels = [l.get_label() for l in lines]
leg = fig.legend(lines, labels, loc='center left',
                 bbox_to_anchor=(0.8, 0.5), bbox_transform=axs[1].transAxes)
try:
    fig.savefig('../../../doc/_static/constrained_layout_2b.png',
                bbox_inches='tight', dpi=100)
except FileNotFoundError:
    # this allows the script to keep going if run interactively and
    # the directory above doesn't exist
    pass
保存的文件如下所示:
填充和间距#
Axes 之间的填充由水平方向的 w_pad 和 wspace 以及垂直方向的 h_pad 和 hspace 控制.可以通过 set 编辑这些值.w/h_pad 是 Axes 周围的最小空间,单位为英寸:
fig, axs = plt.subplots(2, 2, layout="constrained")
for ax in axs.flat:
    example_plot(ax, hide_labels=True)
fig.get_layout_engine().set(w_pad=4 / 72, h_pad=4 / 72, hspace=0,
                            wspace=0)
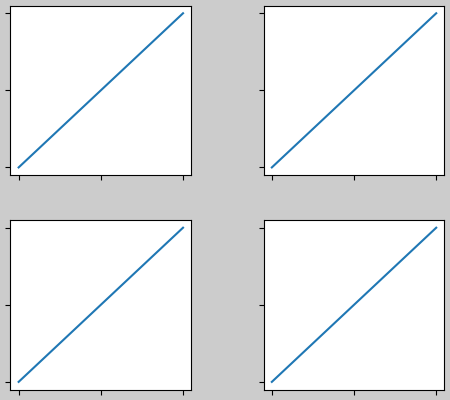
子图之间的间距进一步由 wspace 和 hspace 设置.这些被指定为整个子图组大小的一部分.如果这些值小于 w_pad 或 h_pad,则将使用固定填充.请注意,在下面的示例中,边缘处的空间与上面的示例相比没有变化,但子图之间的空间发生了变化.
fig, axs = plt.subplots(2, 2, layout="constrained")
for ax in axs.flat:
    example_plot(ax, hide_labels=True)
fig.get_layout_engine().set(w_pad=4 / 72, h_pad=4 / 72, hspace=0.2,
                            wspace=0.2)
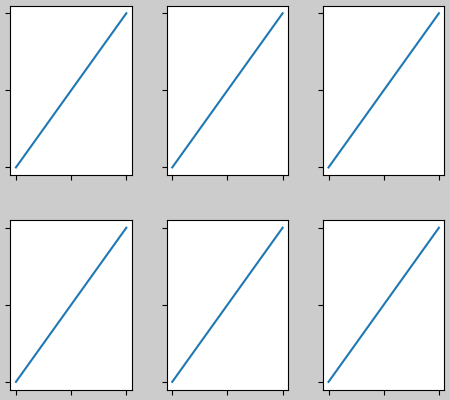
如果有多于两列,则 wspace 在它们之间共享,因此这里的 wspace 被分成两份,每列之间的 wspace 为 0.1:
fig, axs = plt.subplots(2, 3, layout="constrained")
for ax in axs.flat:
    example_plot(ax, hide_labels=True)
fig.get_layout_engine().set(w_pad=4 / 72, h_pad=4 / 72, hspace=0.2,
                            wspace=0.2)
GridSpecs 也有可选的 hspace 和 wspace 关键字参数,它们将代替约束布局设置的 pad 值:
fig, axs = plt.subplots(2, 2, layout="constrained",
                        gridspec_kw={'wspace': 0.3, 'hspace': 0.2})
for ax in axs.flat:
    example_plot(ax, hide_labels=True)
# this has no effect because the space set in the gridspec trumps the
# space set in *constrained layout*.
fig.get_layout_engine().set(w_pad=4 / 72, h_pad=4 / 72, hspace=0.0,
                            wspace=0.0)
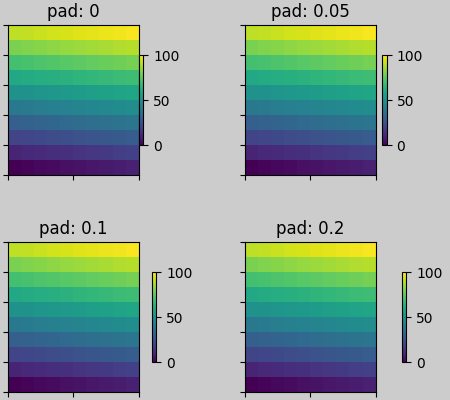
带有颜色条的间距#
颜色条与其父对象之间的距离为 pad,其中 pad 是父对象宽度的分数.到下一个子图的间距由 w/hspace 给出.
fig, axs = plt.subplots(2, 2, layout="constrained")
pads = [0, 0.05, 0.1, 0.2]
for pad, ax in zip(pads, axs.flat):
    pc = ax.pcolormesh(arr, **pc_kwargs)
    fig.colorbar(pc, ax=ax, shrink=0.6, pad=pad)
    ax.set_xticklabels([])
    ax.set_yticklabels([])
    ax.set_title(f'pad: {pad}')
fig.get_layout_engine().set(w_pad=2 / 72, h_pad=2 / 72, hspace=0.2,
                            wspace=0.2)
rcParams#
有五个 rcParams 可以设置,无论是在脚本中还是在 matplotlibrc 文件中. 它们都有前缀 figure.constrained_layout :
use: 是否使用约束布局.默认为 False
w_pad, h_pad: Axes 对象周围的填充.浮点数,代表英寸.默认为 3./72. 英寸 (3 pts)
wspace, hspace: 子图组之间的空间.浮点数,代表被分隔的子图宽度的分数.默认为 0.02.
plt.rcParams['figure.constrained_layout.use'] = True
fig, axs = plt.subplots(2, 2, figsize=(3, 3))
for ax in axs.flat:
    example_plot(ax)
与 GridSpec 一起使用#
约束布局旨在与 subplots() , subplot_mosaic() , 或 GridSpec() 与 add_subplot() 一起使用.
请注意,在下面的内容中 layout="constrained"
plt.rcParams['figure.constrained_layout.use'] = False
fig = plt.figure(layout="constrained")

gs1 = gridspec.GridSpec(2, 1, figure=fig)
ax1 = fig.add_subplot(gs1[0])
ax2 = fig.add_subplot(gs1[1])

example_plot(ax1)
example_plot(ax2)
更复杂的 gridspec 布局是可能的. 请注意,这里我们使用了便捷函数 add_gridspec 和 subgridspec .
fig = plt.figure(layout="constrained")

gs0 = fig.add_gridspec(1, 2)

gs1 = gs0[0].subgridspec(2, 1)
ax1 = fig.add_subplot(gs1[0])
ax2 = fig.add_subplot(gs1[1])

example_plot(ax1)
example_plot(ax2)

gs2 = gs0[1].subgridspec(3, 1)

for ss in gs2:
    ax = fig.add_subplot(ss)
    example_plot(ax)
    ax.set_title("")
    ax.set_xlabel("")

ax.set_xlabel("x-label", fontsize=12)
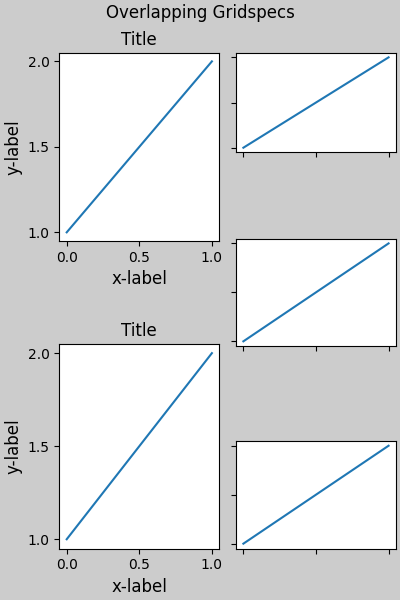
请注意,在上面,左右两列没有相同的垂直范围. 如果我们希望两个网格的顶部和底部对齐,那么它们需要位于同一个 gridspec 中. 我们还需要使这个图形更大,以便 Axes 不会塌陷到零高度:
fig = plt.figure(figsize=(4, 6), layout="constrained")

gs0 = fig.add_gridspec(6, 2)

ax1 = fig.add_subplot(gs0[:3, 0])
ax2 = fig.add_subplot(gs0[3:, 0])

example_plot(ax1)
example_plot(ax2)

ax = fig.add_subplot(gs0[0:2, 1])
example_plot(ax, hide_labels=True)
ax = fig.add_subplot(gs0[2:4, 1])
example_plot(ax, hide_labels=True)
ax = fig.add_subplot(gs0[4:, 1])
example_plot(ax, hide_labels=True)
fig.suptitle('Overlapping Gridspecs')
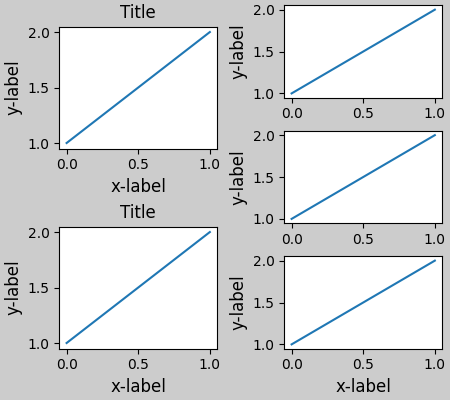
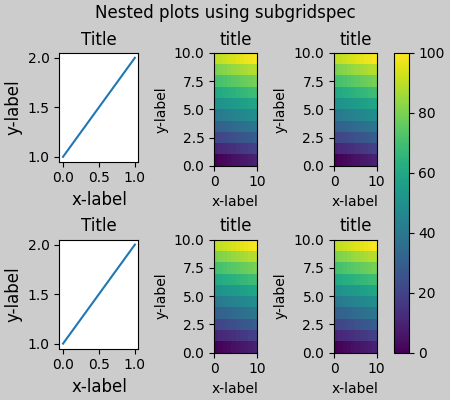
此示例使用两个 gridspecs,使颜色条仅与一组 pcolors 相关. 请注意,由于这个原因,左列比右侧的两列要宽. 当然,如果您希望子图的大小相同,您只需要一个 gridspec. 请注意,可以使用 subfigures 达到同样的效果.
fig = plt.figure(layout="constrained")
gs0 = fig.add_gridspec(1, 2, figure=fig, width_ratios=[1, 2])
gs_left = gs0[0].subgridspec(2, 1)
gs_right = gs0[1].subgridspec(2, 2)

for gs in gs_left:
    ax = fig.add_subplot(gs)
    example_plot(ax)
axs = []
for gs in gs_right:
    ax = fig.add_subplot(gs)
    pcm = ax.pcolormesh(arr, **pc_kwargs)
    ax.set_xlabel('x-label')
    ax.set_ylabel('y-label')
    ax.set_title('title')
    axs += [ax]
fig.suptitle('Nested plots using subgridspec')
fig.colorbar(pcm, ax=axs)
Matplotlib 现在提供了 subfigures ,而不是使用 subgridspecs,它也可以与约束布局一起使用:
fig = plt.figure(layout="constrained")
sfigs = fig.subfigures(1, 2, width_ratios=[1, 2])

axs_left = sfigs[0].subplots(2, 1)
for ax in axs_left.flat:
    example_plot(ax)

axs_right = sfigs[1].subplots(2, 2)
for ax in axs_right.flat:
    pcm = ax.pcolormesh(arr, **pc_kwargs)
    ax.set_xlabel('x-label')
    ax.set_ylabel('y-label')
    ax.set_title('title')
fig.colorbar(pcm, ax=axs_right)
fig.suptitle('Nested plots using subfigures')

手动设置 Axes 位置#
可能有充分的理由手动设置 Axes 位置. 手动调用 set_position 将设置 Axes,使约束布局不再对其产生任何影响.(请注意,约束布局仍然会为移动的 Axes 留下空间).
fig, axs = plt.subplots(1, 2, layout="constrained")
example_plot(axs[0], fontsize=12)
axs[1].set_position([0.2, 0.2, 0.4, 0.4])
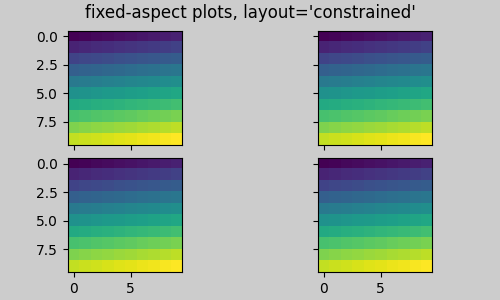
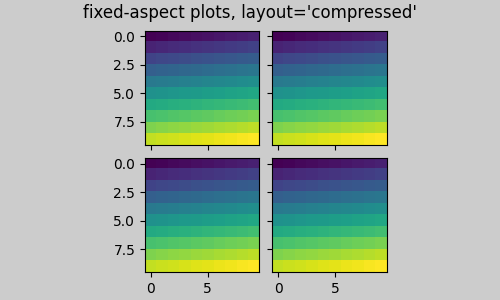
固定宽高比 Axes 的网格:"compressed" 布局#
约束布局在 Axes 的"原始"位置网格上运行. 但是,当 Axes 具有固定的宽高比时,通常会使一侧变短,并在缩短的方向上留下很大的间隙. 在下面,Axes 是正方形的,但图形非常宽,因此存在水平间隙:
fig, axs = plt.subplots(2, 2, figsize=(5, 3),
                        sharex=True, sharey=True, layout="constrained")
for ax in axs.flat:
    ax.imshow(arr)
fig.suptitle("fixed-aspect plots, layout='constrained'")
一种明显的解决方法是使图形尺寸更接近正方形,但是,要完全消除间隙需要反复试验. 对于简单的 Axes 网格,我们可以使用 layout="compressed" 为我们完成这项工作:
fig, axs = plt.subplots(2, 2, figsize=(5, 3),
                        sharex=True, sharey=True, layout='compressed')
for ax in axs.flat:
    ax.imshow(arr)
fig.suptitle("fixed-aspect plots, layout='compressed'")
手动关闭约束布局#
约束布局通常会在每次绘制图形时调整 Axes 的位置. 如果您想获得约束布局提供的间距,但不想使其更新,请执行初始绘制,然后调用 fig.set_layout_engine('none') . 这对于刻度标签可能会改变长度的动画可能很有用.
请注意,对于使用工具栏的后端的 ZOOM 和 PAN GUI 事件,约束布局已关闭. 这样可以防止 Axes 在缩放和平移期间改变位置.
局限性#
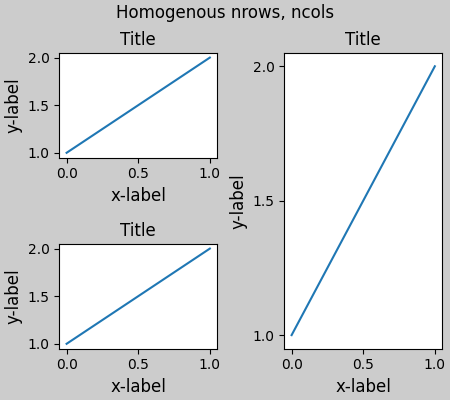
不兼容的函数#
约束布局将与 pyplot.subplot 一起使用,但前提是每次调用的行数和列数都相同. 原因是每次调用 pyplot.subplot 如果几何形状不相同,将创建一个新的 GridSpec 实例,以及约束布局. 因此,以下代码可以正常工作:
fig = plt.figure(layout="constrained")

ax1 = plt.subplot(2, 2, 1)
ax2 = plt.subplot(2, 2, 3)
# third Axes that spans both rows in second column:
ax3 = plt.subplot(2, 2, (2, 4))

example_plot(ax1)
example_plot(ax2)
example_plot(ax3)
plt.suptitle('Homogenous nrows, ncols')
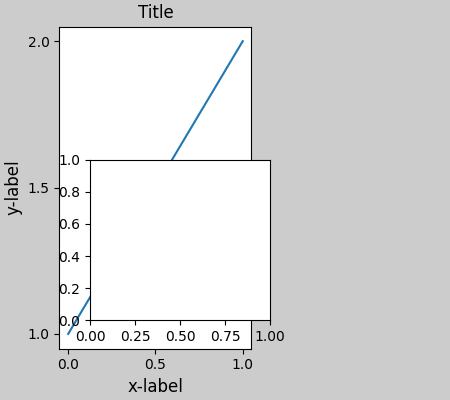
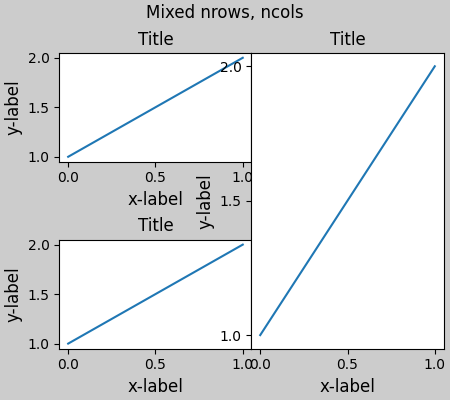
但以下代码会导致较差的布局:
fig = plt.figure(layout="constrained")

ax1 = plt.subplot(2, 2, 1)
ax2 = plt.subplot(2, 2, 3)
ax3 = plt.subplot(1, 2, 2)

example_plot(ax1)
example_plot(ax2)
example_plot(ax3)
plt.suptitle('Mixed nrows, ncols')
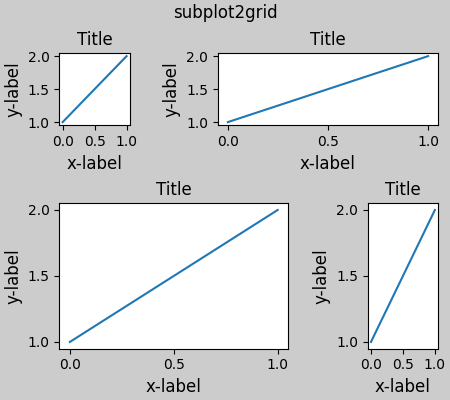
同样, subplot2grid 的工作方式也存在相同的限制,即 nrows 和 ncols 不能更改,布局才能看起来良好.
fig = plt.figure(layout="constrained")

ax1 = plt.subplot2grid((3, 3), (0, 0))
ax2 = plt.subplot2grid((3, 3), (0, 1), colspan=2)
ax3 = plt.subplot2grid((3, 3), (1, 0), colspan=2, rowspan=2)
ax4 = plt.subplot2grid((3, 3), (1, 2), rowspan=2)

example_plot(ax1)
example_plot(ax2)
example_plot(ax3)
example_plot(ax4)
fig.suptitle('subplot2grid')
其他注意事项#
约束布局仅考虑刻度标签,轴标签,标题和图例.因此,其他艺术家可能会被裁剪,也可能会重叠.
它假设刻度标签,轴标签和标题所需的额外空间与
Axes的原始位置无关.这通常是真的,但在极少数情况下并非如此.后端处理字体渲染的方式存在细微差异,因此结果不会完全相同.
An artist using Axes coordinates that extend beyond the Axes boundary will result in unusual layouts when added to an Axes. This can be avoided by adding the artist directly to the
Figureusingadd_artist(). SeeConnectionPatchfor an example.
调试#
约束布局可能会以一些意想不到的方式失败.因为它使用约束求解器,所以求解器可以找到数学上正确的解决方案,但这些解决方案根本不是用户想要的.通常的失败模式是所有尺寸都折叠到其最小允许值.如果发生这种情况,则有两个原因:
没有足够的空间来绘制您请求的元素.
存在错误 - 在这种情况下,请在 matplotlib/matplotlib#issues 上提出问题.
如果存在错误,请报告一个独立的示例,该示例不需要外部数据或依赖项(除了 numpy).
关于算法的注释#
约束算法相对简单,但由于我们可以布局图形的复杂方式,因此具有一定的复杂性.
Matplotlib 中的布局通过 GridSpec 类使用 gridspecs 进行.一个 gridspec 是将图形逻辑划分为行和列,其中这些行和列中 Axes 的相对宽度由 width_ratios 和 height_ratios 设置.
在约束布局中,每个 gridspec 都有一个与之关联的 layoutgrid.layoutgrid 为每列提供一系列 left 和 right 变量,为每行提供 bottom 和 top 变量,此外,它还为 left,right,bottom 和 top 各提供一个边距.在每一行中,底部/顶部边距会加宽,直到容纳该行中的所有装饰器.类似地,对于列和左/右边距.
简单案例:一个 Axes#
对于单个 Axes ,布局很简单.图形有一个父 layoutgrid,由一列和一行组成,以及一个包含 Axes 的 gridspec 的子 layoutgrid,同样由一行和一列组成.在 Axes 的每一侧都为"装饰"留出空间.在代码中,这是通过 do_constrained_layout() 中的条目完成的,例如:
gridspec._layoutgrid[0, 0].edit_margin_min('left',
      -bbox.x0 + pos.x0 + w_pad)
其中 bbox 是 Axes 的紧密边界框, pos 是其位置.请注意,四个边距如何包含 Axes 装饰.
from matplotlib._layoutgrid import plot_children

fig, ax = plt.subplots(layout="constrained")
example_plot(ax, fontsize=24)
plot_children(fig)
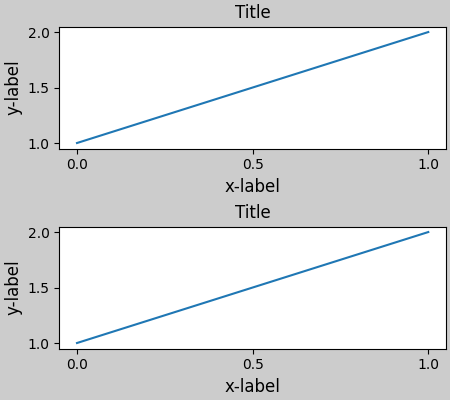
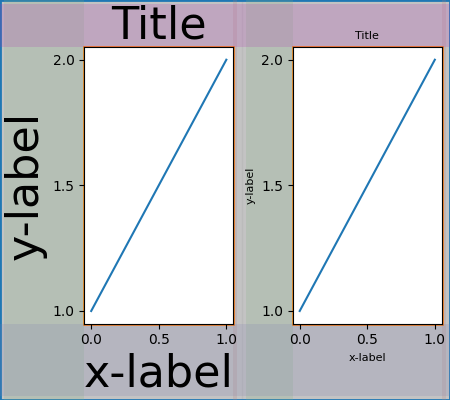
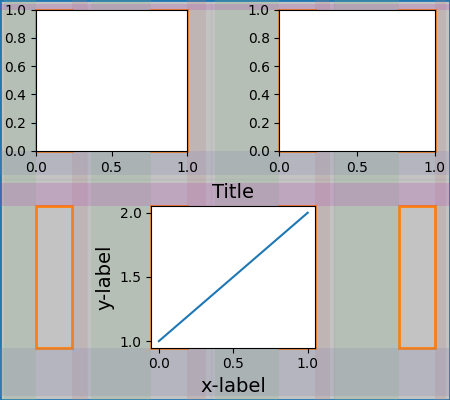
简单案例:两个 Axes#
当有多个 Axes 时,它们的布局以简单的方式绑定.在本例中,左侧 Axes 的装饰比右侧大得多,但它们共享一个底部边距,该边距被放大到足以容纳较大的 xlabel.顶部共享边距也是如此.左右边距不共享,因此允许不同.
fig, ax = plt.subplots(1, 2, layout="constrained")
example_plot(ax[0], fontsize=32)
example_plot(ax[1], fontsize=8)
plot_children(fig)
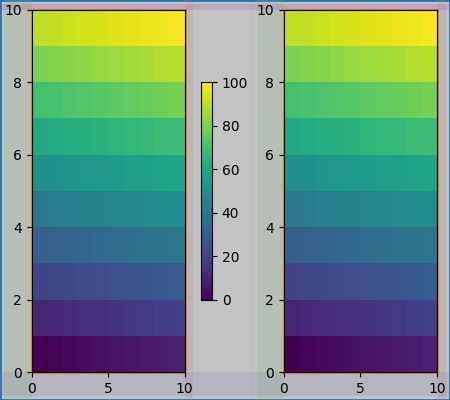
两个 Axes 和颜色条#
颜色条只是扩展父 layoutgrid 单元格边距的另一项:
fig, ax = plt.subplots(1, 2, layout="constrained")
im = ax[0].pcolormesh(arr, **pc_kwargs)
fig.colorbar(im, ax=ax[0], shrink=0.6)
im = ax[1].pcolormesh(arr, **pc_kwargs)
plot_children(fig)
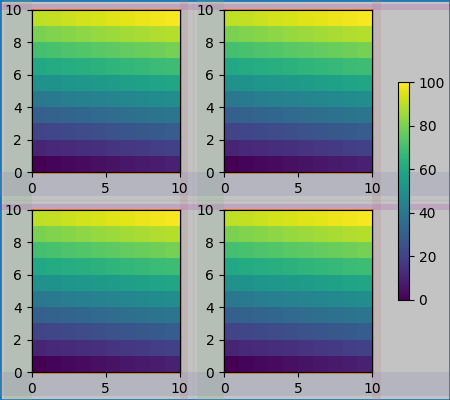
与 Gridspec 关联的颜色条#
如果颜色条属于网格的多个单元格,则它会为每个单元格创建一个更大的边距:
fig, axs = plt.subplots(2, 2, layout="constrained")
for ax in axs.flat:
    im = ax.pcolormesh(arr, **pc_kwargs)
fig.colorbar(im, ax=axs, shrink=0.6)
plot_children(fig)
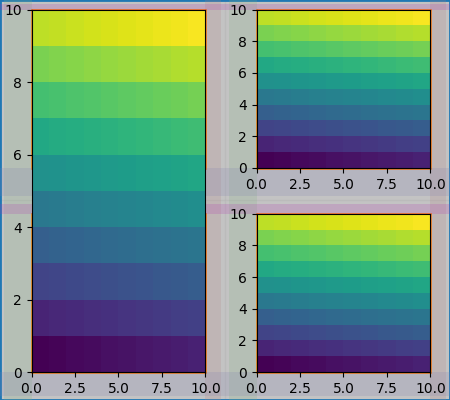
大小不均匀的 Axes#
有两种方法可以使 Axes 在 Gridspec 布局中具有不均匀的大小,可以通过指定它们来跨越 Gridspec 行或列,或者通过指定宽度和高度比率.
这里使用第一种方法.请注意,中间的 top 和 bottom 边距不受左侧列的影响.这是该算法的有意决定,并导致右侧两个 Axes 具有相同的高度,但它不是左侧 Axes 高度的 1/2.这与没有约束布局的 gridspec 的工作方式一致.
fig = plt.figure(layout="constrained")
gs = gridspec.GridSpec(2, 2, figure=fig)
ax = fig.add_subplot(gs[:, 0])
im = ax.pcolormesh(arr, **pc_kwargs)
ax = fig.add_subplot(gs[0, 1])
im = ax.pcolormesh(arr, **pc_kwargs)
ax = fig.add_subplot(gs[1, 1])
im = ax.pcolormesh(arr, **pc_kwargs)
plot_children(fig)
需要精细处理的一种情况是,如果边距没有任何艺术家约束其宽度.在下面的示例中,第 0 列的右边距和第 3 列的左边距没有边距艺术家来设置其宽度,因此我们采用确实有艺术家的边距宽度的最大宽度.这使得所有 Axes 都具有相同的大小:
fig = plt.figure(layout="constrained")
gs = fig.add_gridspec(2, 4)
ax00 = fig.add_subplot(gs[0, 0:2])
ax01 = fig.add_subplot(gs[0, 2:])
ax10 = fig.add_subplot(gs[1, 1:3])
example_plot(ax10, fontsize=14)
plot_children(fig)
plt.show()
脚本总运行时间:(0 分 19.978 秒)