备注
Go to the end 下载完整的示例代码.
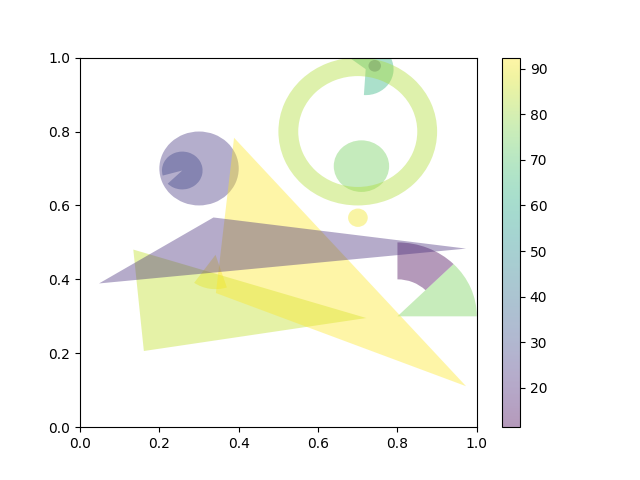
圆,楔和多边形#
此示例演示了如何使用 collections.PatchCollection .
另请参见 Matplotlib artists 参考 ,它将每个艺术家单独添加到其自己的轴.
import matplotlib.pyplot as plt
import numpy as np

from matplotlib.collections import PatchCollection
from matplotlib.patches import Circle, Polygon, Wedge

# Fixing random state for reproducibility
np.random.seed(19680801)


fig, ax = plt.subplots()

resolution = 50  # the number of vertices
N = 3
x = np.random.rand(N)
y = np.random.rand(N)
radii = 0.1*np.random.rand(N)
patches = []
for x1, y1, r in zip(x, y, radii):
    circle = Circle((x1, y1), r)
    patches.append(circle)

x = np.random.rand(N)
y = np.random.rand(N)
radii = 0.1*np.random.rand(N)
theta1 = 360.0*np.random.rand(N)
theta2 = 360.0*np.random.rand(N)
for x1, y1, r, t1, t2 in zip(x, y, radii, theta1, theta2):
    wedge = Wedge((x1, y1), r, t1, t2)
    patches.append(wedge)

# Some limiting conditions on Wedge
patches += [
    Wedge((.3, .7), .1, 0, 360),             # Full circle
    Wedge((.7, .8), .2, 0, 360, width=0.05),  # Full ring
    Wedge((.8, .3), .2, 0, 45),              # Full sector
    Wedge((.8, .3), .2, 45, 90, width=0.10),  # Ring sector
]

for i in range(N):
    polygon = Polygon(np.random.rand(N, 2), closed=True)
    patches.append(polygon)

colors = 100 * np.random.rand(len(patches))
p = PatchCollection(patches, alpha=0.4)
p.set_array(colors)
ax.add_collection(p)
fig.colorbar(p, ax=ax)

plt.show()
参考
以下函数,方法,类和模块的用法在本例中显示:
matplotlib.patchesmatplotlib.patches.Circlematplotlib.patches.Wedgematplotlib.patches.Polygonmatplotlib.collections.PatchCollectionmatplotlib.collections.Collection.set_arraymatplotlib.axes.Axes.add_collectionmatplotlib.figure.Figure.colorbar