备注
Go to the end to download the full example code..
带有独立柱状颜色的柱状图#
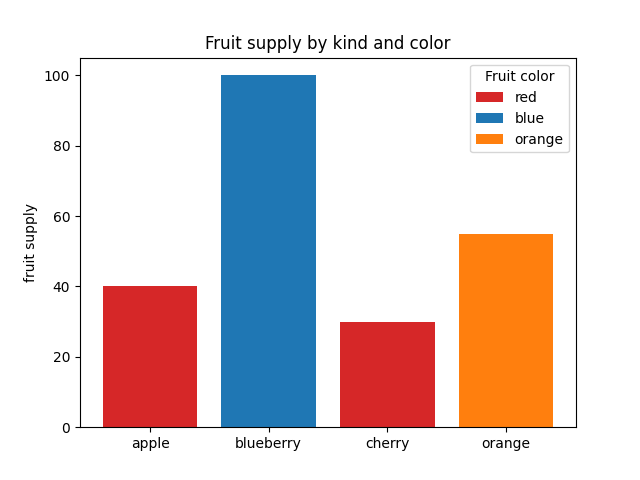
本例展示了如何使用 bar 的 color 和 label 参数来控制柱状颜色和图例条目.请注意,带有前导下划线的标签不会显示在图例中.
import matplotlib.pyplot as plt

fig, ax = plt.subplots()

fruits = ['apple', 'blueberry', 'cherry', 'orange']
counts = [40, 100, 30, 55]
bar_labels = ['red', 'blue', '_red', 'orange']
bar_colors = ['tab:red', 'tab:blue', 'tab:red', 'tab:orange']

ax.bar(fruits, counts, label=bar_labels, color=bar_colors)

ax.set_ylabel('fruit supply')
ax.set_title('Fruit supply by kind and color')
ax.legend(title='Fruit color')

plt.show()