备注
Go to the end 下载完整示例代码.
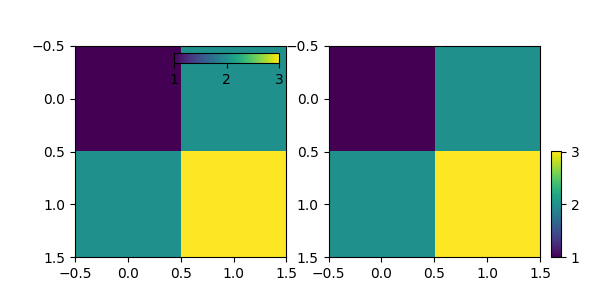
使用 Inset Axes 控制颜色条的位置和大小#
此示例展示如何使用 inset_axes 控制颜色条的位置,高度和宽度.
Inset Axes 的放置方式与图例相同:可以通过提供 loc 选项("upper right","best",...),也可以通过提供相对于父边界框的定位器.*bbox_to_anchor* 和 borderpad 等参数也以相同的方式工作,并且也在此处进行了演示.
用户应考虑使用 Axes.inset_axes 代替(请参阅 放置颜色条 ).
import matplotlib.pyplot as plt

from mpl_toolkits.axes_grid1.inset_locator import inset_axes

fig, (ax1, ax2) = plt.subplots(1, 2, figsize=[6, 3])

im1 = ax1.imshow([[1, 2], [2, 3]])
axins1 = inset_axes(
    ax1,
    width="50%",  # width: 50% of parent_bbox width
    height="5%",  # height: 5%
    loc="upper right",
)
axins1.xaxis.set_ticks_position("bottom")
fig.colorbar(im1, cax=axins1, orientation="horizontal", ticks=[1, 2, 3])

im = ax2.imshow([[1, 2], [2, 3]])
axins = inset_axes(
    ax2,
    width="5%",  # width: 5% of parent_bbox width
    height="50%",  # height: 50%
    loc="lower left",
    bbox_to_anchor=(1.05, 0., 1, 1),
    bbox_transform=ax2.transAxes,
    borderpad=0,
)
fig.colorbar(im, cax=axins, ticks=[1, 2, 3])

plt.show()