备注
Go to the end 下载完整的示例代码.
日期精度和纪元#
Matplotlib 可以处理 datetime 对象和 numpy.datetime64 对象,使用一个单元转换器来识别这些日期并将它们转换为浮点数.
在 Matplotlib 3.3 之前,此转换的默认值返回一个浮点数,该浮点数是自"0000-12-31T00:00:00"以来的天数.从 Matplotlib 3.3 开始,默认值是自"1970-01-01T00:00:00"以来的天数.这允许为现代日期提供更高的分辨率.使用旧纪元将"2020-01-01"转换为 730120,并且 64 位浮点数的分辨率为 2^{-52},或大约 14 微秒,因此会丢失微秒精度.使用新的默认纪元,"2020-01-01"为 10957.0,因此可实现的分辨率为 0.21 微秒.
import datetime

import matplotlib.pyplot as plt
import numpy as np

import matplotlib.dates as mdates


def _reset_epoch_for_tutorial():
    """
    Users (and downstream libraries) should not use the private method of
    resetting the epoch.
    """
    mdates._reset_epoch_test_example()
Datetime#
Python 的 datetime 对象具有微秒级分辨率,因此使用旧的默认值,matplotlib 日期无法完整地来回转换全分辨率的 datetime 对象.
old_epoch = '0000-12-31T00:00:00'
new_epoch = '1970-01-01T00:00:00'

_reset_epoch_for_tutorial()  # Don't do this.  Just for this tutorial.
mdates.set_epoch(old_epoch)  # old epoch (pre MPL 3.3)

date1 = datetime.datetime(2000, 1, 1, 0, 10, 0, 12,
                          tzinfo=datetime.timezone.utc)
mdate1 = mdates.date2num(date1)
print('Before Roundtrip: ', date1, 'Matplotlib date:', mdate1)
date2 = mdates.num2date(mdate1)
print('After Roundtrip:  ', date2)
Before Roundtrip:  2000-01-01 00:10:00.000012+00:00 Matplotlib date: 730120.0069444446
After Roundtrip:   2000-01-01 00:10:00.000020+00:00
注意,这只是一个舍入误差,对于更接近旧 epoch 的日期没有问题:
date1 = datetime.datetime(10, 1, 1, 0, 10, 0, 12,
                          tzinfo=datetime.timezone.utc)
mdate1 = mdates.date2num(date1)
print('Before Roundtrip: ', date1, 'Matplotlib date:', mdate1)
date2 = mdates.num2date(mdate1)
print('After Roundtrip:  ', date2)
Before Roundtrip:  0010-01-01 00:10:00.000012+00:00 Matplotlib date: 3288.006944444583
After Roundtrip:   0010-01-01 00:10:00.000012+00:00
如果用户想要以微秒精度使用现代日期,他们可以使用 set_epoch 更改 epoch.但是,必须在任何日期操作之前设置 epoch,以防止不同 epoch 之间的混淆.尝试稍后更改 epoch 将引发 RuntimeError .
try:
    mdates.set_epoch(new_epoch)  # this is the new MPL 3.3 default.
except RuntimeError as e:
    print('RuntimeError:', str(e))
RuntimeError: set_epoch must be called before dates plotted.
在本教程中,我们使用私有方法重置 sentinel,但用户应该只设置一次 epoch(如果需要).
_reset_epoch_for_tutorial()  # Just being done for this tutorial.
mdates.set_epoch(new_epoch)

date1 = datetime.datetime(2020, 1, 1, 0, 10, 0, 12,
                          tzinfo=datetime.timezone.utc)
mdate1 = mdates.date2num(date1)
print('Before Roundtrip: ', date1, 'Matplotlib date:', mdate1)
date2 = mdates.num2date(mdate1)
print('After Roundtrip:  ', date2)
Before Roundtrip:  2020-01-01 00:10:00.000012+00:00 Matplotlib date: 18262.006944444583
After Roundtrip:   2020-01-01 00:10:00.000012+00:00
datetime64#
numpy.datetime64 对象比 datetime 对象具有更大的时间范围内微秒级精度.但是,目前 Matplotlib 时间仅转换回具有微秒分辨率且年份仅跨越 0000 到 9999 的 datetime 对象.
_reset_epoch_for_tutorial()  # Don't do this.  Just for this tutorial.
mdates.set_epoch(new_epoch)

date1 = np.datetime64('2000-01-01T00:10:00.000012')
mdate1 = mdates.date2num(date1)
print('Before Roundtrip: ', date1, 'Matplotlib date:', mdate1)
date2 = mdates.num2date(mdate1)
print('After Roundtrip:  ', date2)
Before Roundtrip:  2000-01-01T00:10:00.000012 Matplotlib date: 10957.006944444583
After Roundtrip:   2000-01-01 00:10:00.000012+00:00
绘图#
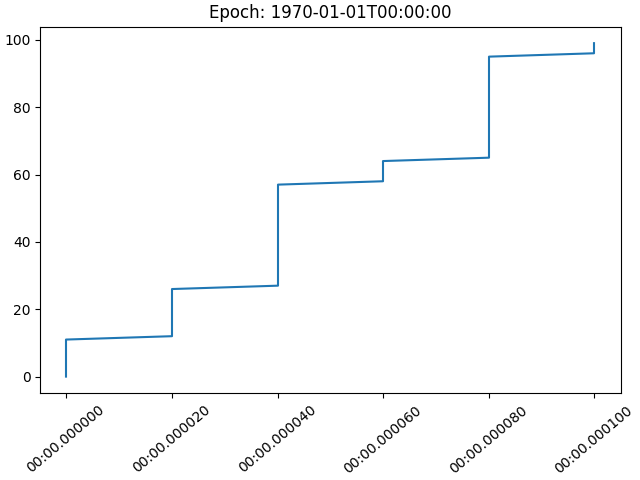
这当然会对绘图产生影响.使用旧的默认 epoch,时间在内部 date2num 转换期间被舍入,导致数据出现跳跃:
_reset_epoch_for_tutorial()  # Don't do this.  Just for this tutorial.
mdates.set_epoch(old_epoch)

x = np.arange('2000-01-01T00:00:00.0', '2000-01-01T00:00:00.000100',
              dtype='datetime64[us]')
# simulate the plot being made using the old epoch
xold = np.array([mdates.num2date(mdates.date2num(d)) for d in x])
y = np.arange(0, len(x))

# resetting the Epoch so plots are comparable
_reset_epoch_for_tutorial()  # Don't do this.  Just for this tutorial.
mdates.set_epoch(new_epoch)

fig, ax = plt.subplots(layout='constrained')
ax.plot(xold, y)
ax.set_title('Epoch: ' + mdates.get_epoch())
ax.xaxis.set_tick_params(rotation=40)
plt.show()
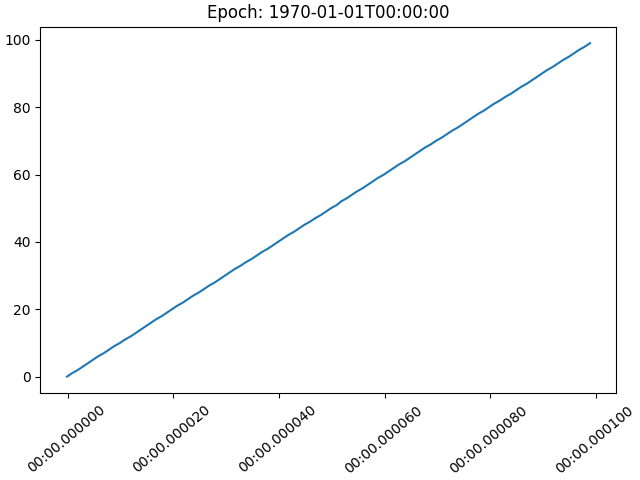
对于使用较新的 epoch 绘制的日期,该图是平滑的:
fig, ax = plt.subplots(layout='constrained')
ax.plot(x, y)
ax.set_title('Epoch: ' + mdates.get_epoch())
ax.xaxis.set_tick_params(rotation=40)
plt.show()

_reset_epoch_for_tutorial()  # Don't do this.  Just for this tutorial.
参考
以下函数,方法,类和模块的用法在本例中显示:
matplotlib.dates.num2datematplotlib.dates.date2nummatplotlib.dates.set_epoch