以编程方式控制子图调整
Programmatically control subplot adjustment
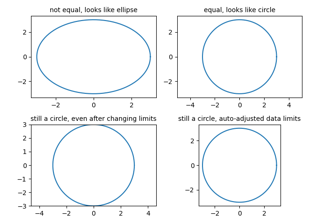
相等轴纵横比
Equal axis aspect ratio
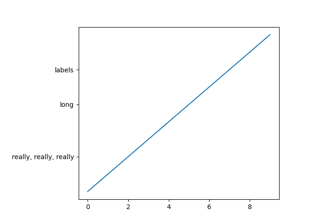
轴标签位置
Axis label position
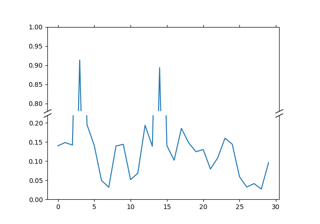
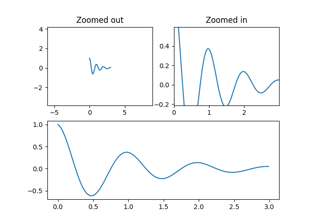
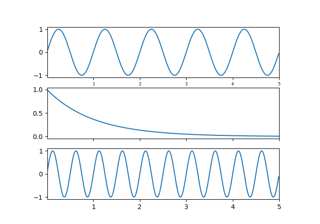
断裂轴
Broken axis
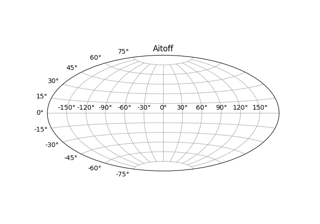
地理投影
Geographic Projections
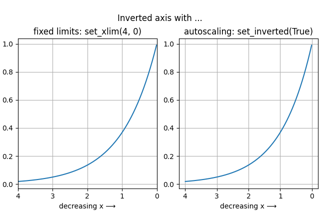
反转轴
Inverted axis
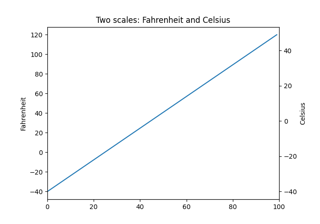
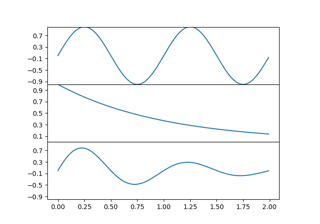
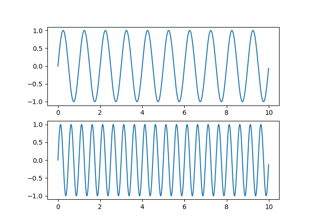
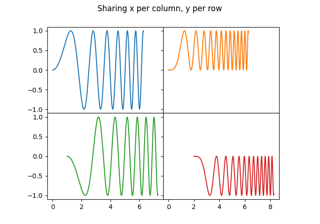
共享轴
Shared axis
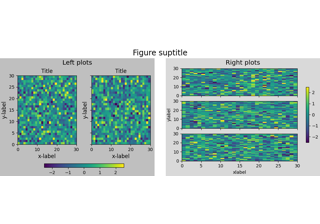
图形子图
Figure subfigures
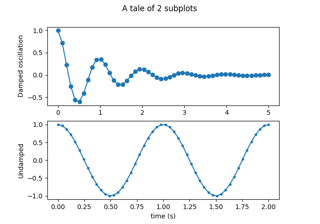
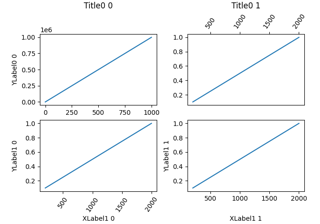
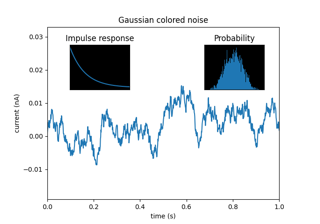
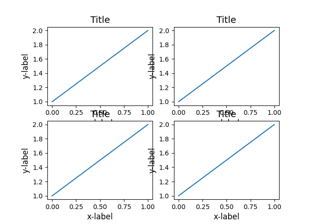
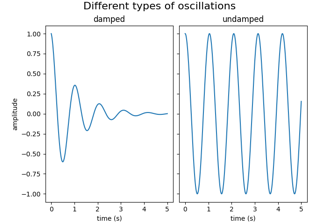
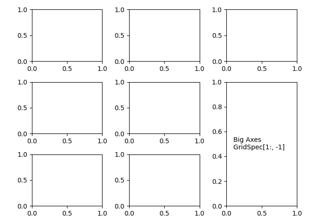
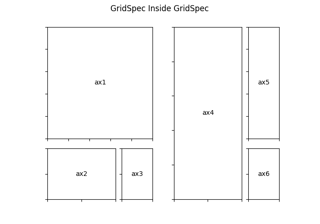
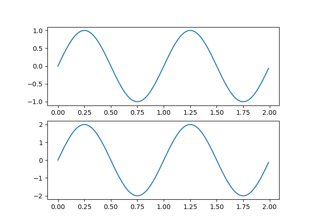
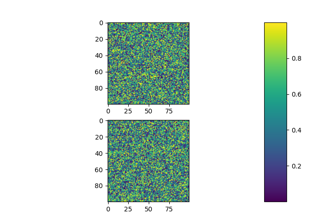
多个子图
Multiple subplots
子图间距和边距
Subplots spacings and margins