备注
Go to the end 下载完整的示例代码.
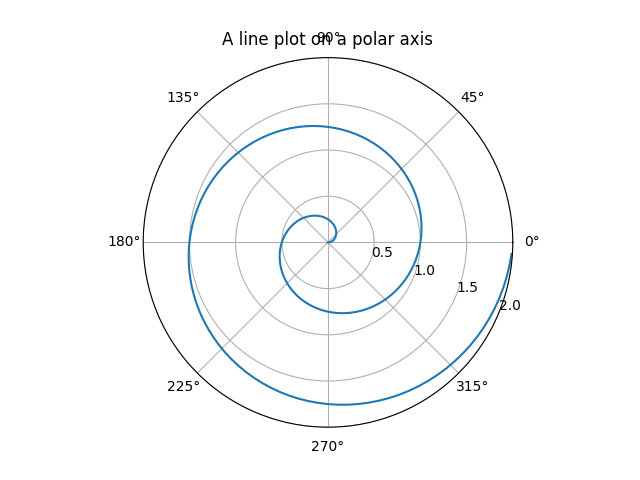
极坐标图#
极坐标轴上折线图的演示.
import matplotlib.pyplot as plt
import numpy as np

r = np.arange(0, 2, 0.01)
theta = 2 * np.pi * r

fig, ax = plt.subplots(subplot_kw={'projection': 'polar'})
ax.plot(theta, r)
ax.set_rmax(2)
ax.set_rticks([0.5, 1, 1.5, 2])  # Less radial ticks
ax.set_rlabel_position(-22.5)  # Move radial labels away from plotted line
ax.grid(True)

ax.set_title("A line plot on a polar axis", va='bottom')
plt.show()
参考
以下函数,方法,类和模块的用法在本例中显示:
matplotlib.axes.Axes.plot/matplotlib.pyplot.plotmatplotlib.projections.polarmatplotlib.projections.polar.PolarAxesmatplotlib.projections.polar.PolarAxes.set_rticksmatplotlib.projections.polar.PolarAxes.set_rmaxmatplotlib.projections.polar.PolarAxes.set_rlabel_position