备注
Go to the end 下载完整的示例代码.
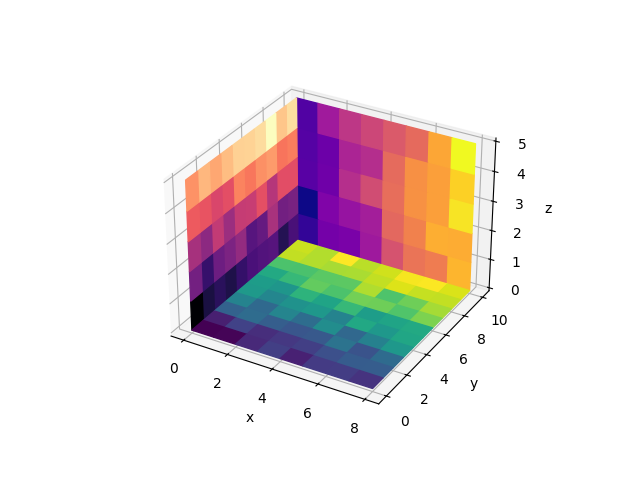
3D 中的 2D 图像#
此示例演示如何将 2D 颜色编码图像(类似于 Axes.imshow )绘制为 3D 中的平面.
Matplotlib 没有用于此的本机函数. 下面我们通过依赖 Axes3D.plot_surface 构建一个. 为简单起见,与 Axes.imshow 存在一些差异:此函数不设置 Axes 的纵横比,因此像素不一定是正方形. 此外,像素边缘位于整数值上,而不是像素中心. 此外,未实现 Axes.imshow 的许多可选参数.
默认情况下,多次调用 imshow3d 使用独立的范数,因此使用不同的颜色刻度. 如果您想要使用单个通用颜色刻度,则需要事先构建合适的范数并将其传递给所有 imshow3d 调用.
3D绘图引擎的一个根本限制是,无法正确绘制相交对象.一个对象总是在另一个对象之后绘制.因此,正如此示例中所示,可以在背景中很好地使用多个图像平面.但是,如果平面相交,则此方法不适用.
import matplotlib.pyplot as plt
import numpy as np

from matplotlib.colors import Normalize


def imshow3d(ax, array, value_direction='z', pos=0, norm=None, cmap=None):
    """
    Display a 2D array as a  color-coded 2D image embedded in 3d.

    The image will be in a plane perpendicular to the coordinate axis *value_direction*.

    Parameters
    ----------
    ax : Axes3D
        The 3D Axes to plot into.
    array : 2D numpy array
        The image values.
    value_direction : {'x', 'y', 'z'}
        The axis normal to the image plane.
    pos : float
        The numeric value on the *value_direction* axis at which the image plane is
        located.
    norm : `~matplotlib.colors.Normalize`, default: Normalize
        The normalization method used to scale scalar data. See `imshow()`.
    cmap : str or `~matplotlib.colors.Colormap`, default: :rc:`image.cmap`
        The Colormap instance or registered colormap name used to map scalar data
        to colors.
    """
    if norm is None:
        norm = Normalize()
    colors = plt.get_cmap(cmap)(norm(array))

    if value_direction == 'x':
        nz, ny = array.shape
        zi, yi = np.mgrid[0:nz + 1, 0:ny + 1]
        xi = np.full_like(yi, pos)
    elif value_direction == 'y':
        nx, nz = array.shape
        xi, zi = np.mgrid[0:nx + 1, 0:nz + 1]
        yi = np.full_like(zi, pos)
    elif value_direction == 'z':
        ny, nx = array.shape
        yi, xi = np.mgrid[0:ny + 1, 0:nx + 1]
        zi = np.full_like(xi, pos)
    else:
        raise ValueError(f"Invalid value_direction: {value_direction!r}")
    ax.plot_surface(xi, yi, zi, rstride=1, cstride=1, facecolors=colors, shade=False)


fig = plt.figure()
ax = fig.add_subplot(projection='3d')
ax.set(xlabel="x", ylabel="y", zlabel="z")

nx, ny, nz = 8, 10, 5
data_xy = np.arange(ny * nx).reshape(ny, nx) + 15 * np.random.random((ny, nx))
data_yz = np.arange(nz * ny).reshape(nz, ny) + 10 * np.random.random((nz, ny))
data_zx = np.arange(nx * nz).reshape(nx, nz) + 8 * np.random.random((nx, nz))

imshow3d(ax, data_xy)
imshow3d(ax, data_yz, value_direction='x', cmap='magma')
imshow3d(ax, data_zx, value_direction='y', pos=ny, cmap='plasma')

plt.show()