备注
Go to the end 下载完整的示例代码.
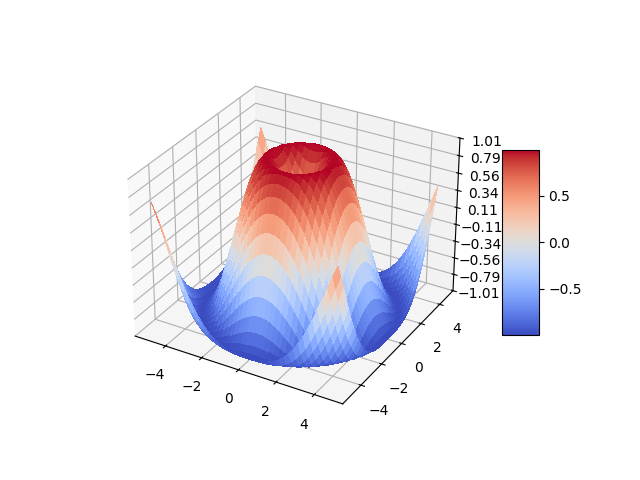
3D 表面(颜色图)#
演示如何绘制使用 coolwarm 颜色图着色的 3D 表面.通过使用 antialiased=False 使表面不透明.
还演示了如何使用 LinearLocator 和自定义格式设置 z 轴刻度标签.
import matplotlib.pyplot as plt
import numpy as np

from matplotlib import cm
from matplotlib.ticker import LinearLocator

fig, ax = plt.subplots(subplot_kw={"projection": "3d"})

# Make data.
X = np.arange(-5, 5, 0.25)
Y = np.arange(-5, 5, 0.25)
X, Y = np.meshgrid(X, Y)
R = np.sqrt(X**2 + Y**2)
Z = np.sin(R)

# Plot the surface.
surf = ax.plot_surface(X, Y, Z, cmap=cm.coolwarm,
                       linewidth=0, antialiased=False)

# Customize the z axis.
ax.set_zlim(-1.01, 1.01)
ax.zaxis.set_major_locator(LinearLocator(10))
# A StrMethodFormatter is used automatically
ax.zaxis.set_major_formatter('{x:.02f}')

# Add a color bar which maps values to colors.
fig.colorbar(surf, shrink=0.5, aspect=5)

plt.show()
参考
以下函数,方法,类和模块的用法在本例中显示:
matplotlib.pyplot.subplotsmatplotlib.axis.Axis.set_major_formattermatplotlib.axis.Axis.set_major_locatormatplotlib.ticker.LinearLocatormatplotlib.ticker.StrMethodFormatter