备注
Go to the end 下载完整的示例代码.
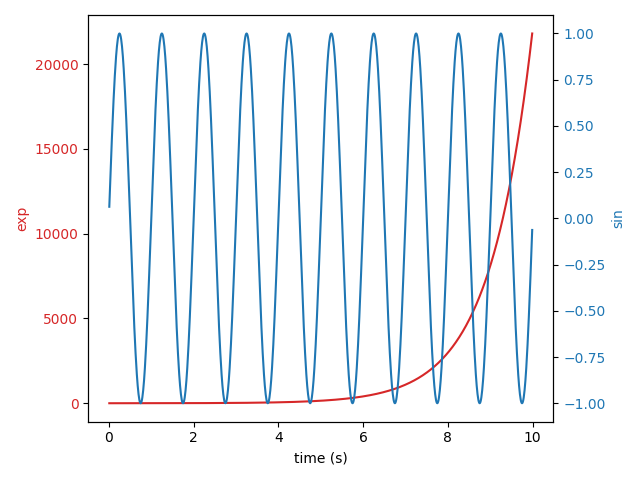
具有不同比例的绘图#
在同一轴上,使用不同的左右比例绘制两个图.
诀窍是使用共享相同 x 轴的两个不同的轴. 你可以根据需要使用单独的 matplotlib.ticker 格式化程序和定位器,因为这两个轴是独立的.
这样的轴是通过调用 Axes.twinx 方法生成的. 同样, Axes.twiny 可用于生成共享 y 轴但具有不同顶部和底部比例的轴.
import matplotlib.pyplot as plt
import numpy as np

# Create some mock data
t = np.arange(0.01, 10.0, 0.01)
data1 = np.exp(t)
data2 = np.sin(2 * np.pi * t)

fig, ax1 = plt.subplots()

color = 'tab:red'
ax1.set_xlabel('time (s)')
ax1.set_ylabel('exp', color=color)
ax1.plot(t, data1, color=color)
ax1.tick_params(axis='y', labelcolor=color)

ax2 = ax1.twinx()  # instantiate a second Axes that shares the same x-axis

color = 'tab:blue'
ax2.set_ylabel('sin', color=color)  # we already handled the x-label with ax1
ax2.plot(t, data2, color=color)
ax2.tick_params(axis='y', labelcolor=color)

fig.tight_layout()  # otherwise the right y-label is slightly clipped
plt.show()
参考
以下函数,方法,类和模块的用法在本例中显示:
matplotlib.axes.Axes.twinx/matplotlib.pyplot.twinxmatplotlib.axes.Axes.twiny/matplotlib.pyplot.twinymatplotlib.axes.Axes.tick_params/matplotlib.pyplot.tick_params