备注
Go to the end 下载完整的示例代码..
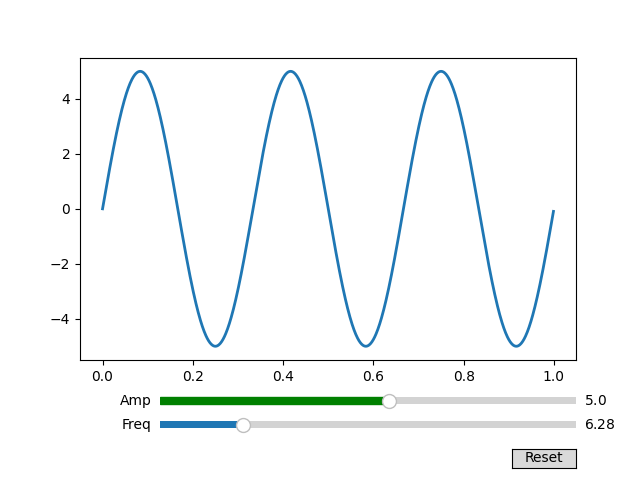
将滑块捕捉到离散值#
您可以使用 valstep 参数将滑块值捕捉到离散值.
在此示例中,Freq滑块被约束为pi的倍数,并且Amp滑块使用数组作为 valstep 参数,以更密集地采样其范围的第一部分.
有关使用 Slider 控制单个浮点数的示例,请参见 滑块 .
有关使用 RangeSlider 定义值范围的示例,请参见 使用 RangeSlider 进行图像缩放 .
import matplotlib.pyplot as plt
import numpy as np

from matplotlib.widgets import Button, Slider

t = np.arange(0.0, 1.0, 0.001)
a0 = 5
f0 = 3
s = a0 * np.sin(2 * np.pi * f0 * t)

fig, ax = plt.subplots()
fig.subplots_adjust(bottom=0.25)
l, = ax.plot(t, s, lw=2)

ax_freq = fig.add_axes([0.25, 0.1, 0.65, 0.03])
ax_amp = fig.add_axes([0.25, 0.15, 0.65, 0.03])

# define the values to use for snapping
allowed_amplitudes = np.concatenate([np.linspace(.1, 5, 100), [6, 7, 8, 9]])

# create the sliders
samp = Slider(
    ax_amp, "Amp", 0.1, 9.0,
    valinit=a0, valstep=allowed_amplitudes,
    color="green"
)

sfreq = Slider(
    ax_freq, "Freq", 0, 10*np.pi,
    valinit=2*np.pi, valstep=np.pi,
    initcolor='none'  # Remove the line marking the valinit position.
)


def update(val):
    amp = samp.val
    freq = sfreq.val
    l.set_ydata(amp*np.sin(2*np.pi*freq*t))
    fig.canvas.draw_idle()


sfreq.on_changed(update)
samp.on_changed(update)

ax_reset = fig.add_axes([0.8, 0.025, 0.1, 0.04])
button = Button(ax_reset, 'Reset', hovercolor='0.975')


def reset(event):
    sfreq.reset()
    samp.reset()
button.on_clicked(reset)


plt.show()
参考
以下函数,方法,类和模块的用法在本例中显示:
matplotlib.widgets.Slider` matplotlib.widgets.Button `