备注
Go to the end 来下载完整的示例代码.
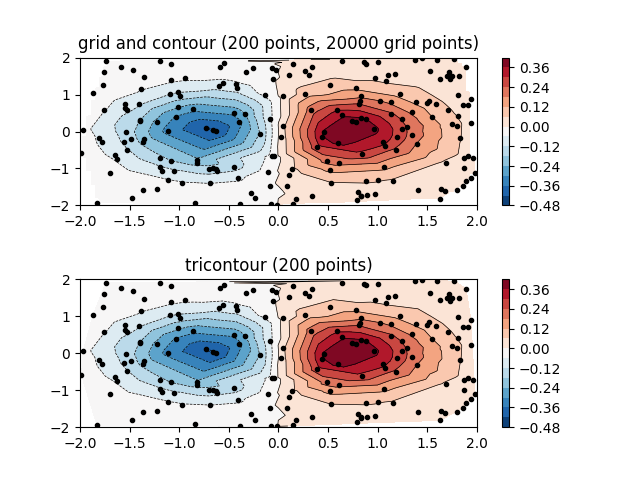
不规则间隔数据的等高线图#
比较在规则网格上插值的不规则间隔数据的等高线图与非结构化三角形网格的 tricontour 图.
由于 contour 和 contourf 期望数据位于规则网格上,因此绘制不规则间隔数据的等高线图需要不同的方法. 有两个选择:
首先将数据插值到规则网格. 这可以通过板载方式完成,例如通过
LinearTriInterpolator或使用外部功能(例如通过scipy.interpolate.griddata). 然后使用通常的contour绘制插值数据.直接使用
tricontour或tricontourf,它们将在内部执行三角剖分.
此示例显示了这两种方法的实际应用.
import matplotlib.pyplot as plt
import numpy as np

import matplotlib.tri as tri

np.random.seed(19680801)
npts = 200
ngridx = 100
ngridy = 200
x = np.random.uniform(-2, 2, npts)
y = np.random.uniform(-2, 2, npts)
z = x * np.exp(-x**2 - y**2)

fig, (ax1, ax2) = plt.subplots(nrows=2)

# -----------------------
# Interpolation on a grid
# -----------------------
# A contour plot of irregularly spaced data coordinates
# via interpolation on a grid.

# Create grid values first.
xi = np.linspace(-2.1, 2.1, ngridx)
yi = np.linspace(-2.1, 2.1, ngridy)

# Linearly interpolate the data (x, y) on a grid defined by (xi, yi).
triang = tri.Triangulation(x, y)
interpolator = tri.LinearTriInterpolator(triang, z)
Xi, Yi = np.meshgrid(xi, yi)
zi = interpolator(Xi, Yi)

# Note that scipy.interpolate provides means to interpolate data on a grid
# as well. The following would be an alternative to the four lines above:
# from scipy.interpolate import griddata
# zi = griddata((x, y), z, (xi[None, :], yi[:, None]), method='linear')

ax1.contour(xi, yi, zi, levels=14, linewidths=0.5, colors='k')
cntr1 = ax1.contourf(xi, yi, zi, levels=14, cmap="RdBu_r")

fig.colorbar(cntr1, ax=ax1)
ax1.plot(x, y, 'ko', ms=3)
ax1.set(xlim=(-2, 2), ylim=(-2, 2))
ax1.set_title('grid and contour (%d points, %d grid points)' %
              (npts, ngridx * ngridy))

# ----------
# Tricontour
# ----------
# Directly supply the unordered, irregularly spaced coordinates
# to tricontour.

ax2.tricontour(x, y, z, levels=14, linewidths=0.5, colors='k')
cntr2 = ax2.tricontourf(x, y, z, levels=14, cmap="RdBu_r")

fig.colorbar(cntr2, ax=ax2)
ax2.plot(x, y, 'ko', ms=3)
ax2.set(xlim=(-2, 2), ylim=(-2, 2))
ax2.set_title('tricontour (%d points)' % npts)

plt.subplots_adjust(hspace=0.5)
plt.show()
参考
以下函数,方法,类和模块的用法在本例中显示:
matplotlib.axes.Axes.contour/matplotlib.pyplot.contourmatplotlib.axes.Axes.contourf/matplotlib.pyplot.contourfmatplotlib.axes.Axes.tricontour/matplotlib.pyplot.tricontourmatplotlib.axes.Axes.tricontourf/matplotlib.pyplot.tricontourf