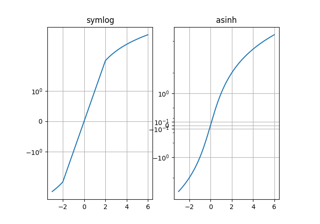
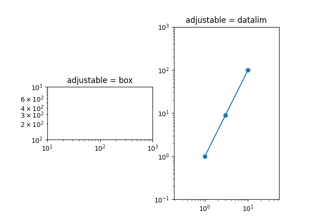
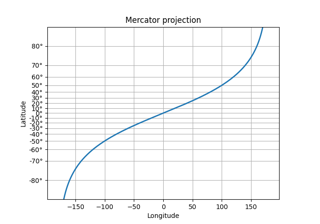
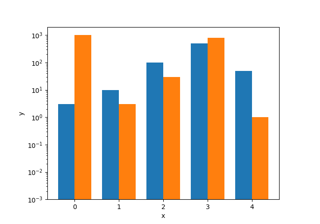
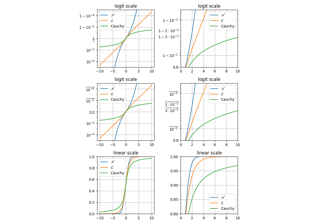
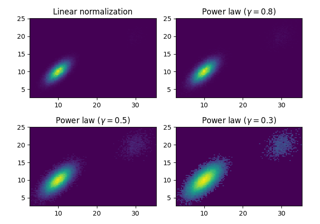
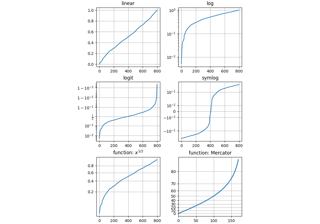
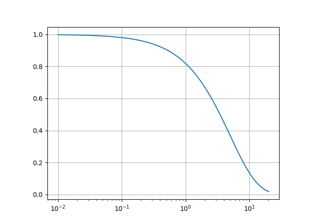
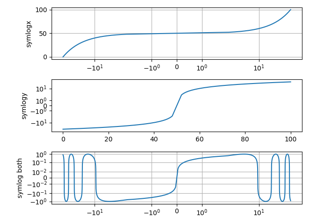
标度# 这些示例涵盖了 Matplotlib 中如何处理不同的标度. Asinh 演示 Asinh Demo Loglog 纵横比 Loglog aspect 自定义比例 Custom scale 对数柱状图 Log Bar 演示对数坐标轴 Log Demo Logit 演示 Logit Demo 探索归一化 Exploring normalizations 标度 Scales 对数轴 Log Axis Symlog 演示 Symlog Demo