备注
Go to the end 下载完整示例代码.
命名颜色列表#
这绘制了 Matplotlib 支持的命名颜色列表.有关 matplotlib 中颜色的更多信息,请参见
绘图用的辅助函数#
首先,我们定义一个辅助函数来制作颜色表,然后在一些常见的颜色类别上使用它.
import math

import matplotlib.pyplot as plt

import matplotlib.colors as mcolors
from matplotlib.patches import Rectangle


def plot_colortable(colors, *, ncols=4, sort_colors=True):

    cell_width = 212
    cell_height = 22
    swatch_width = 48
    margin = 12

    # Sort colors by hue, saturation, value and name.
    if sort_colors is True:
        names = sorted(
            colors, key=lambda c: tuple(mcolors.rgb_to_hsv(mcolors.to_rgb(c))))
    else:
        names = list(colors)

    n = len(names)
    nrows = math.ceil(n / ncols)

    width = cell_width * ncols + 2 * margin
    height = cell_height * nrows + 2 * margin
    dpi = 72

    fig, ax = plt.subplots(figsize=(width / dpi, height / dpi), dpi=dpi)
    fig.subplots_adjust(margin/width, margin/height,
                        (width-margin)/width, (height-margin)/height)
    ax.set_xlim(0, cell_width * ncols)
    ax.set_ylim(cell_height * (nrows-0.5), -cell_height/2.)
    ax.yaxis.set_visible(False)
    ax.xaxis.set_visible(False)
    ax.set_axis_off()

    for i, name in enumerate(names):
        row = i % nrows
        col = i // nrows
        y = row * cell_height

        swatch_start_x = cell_width * col
        text_pos_x = cell_width * col + swatch_width + 7

        ax.text(text_pos_x, y, name, fontsize=14,
                horizontalalignment='left',
                verticalalignment='center')

        ax.add_patch(
            Rectangle(xy=(swatch_start_x, y-9), width=swatch_width,
                      height=18, facecolor=colors[name], edgecolor='0.7')
        )

    return fig
基本颜色#
plot_colortable(mcolors.BASE_COLORS, ncols=3, sort_colors=False)

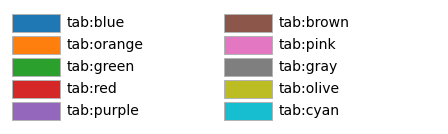
Tableau 调色板#
plot_colortable(mcolors.TABLEAU_COLORS, ncols=2, sort_colors=False)
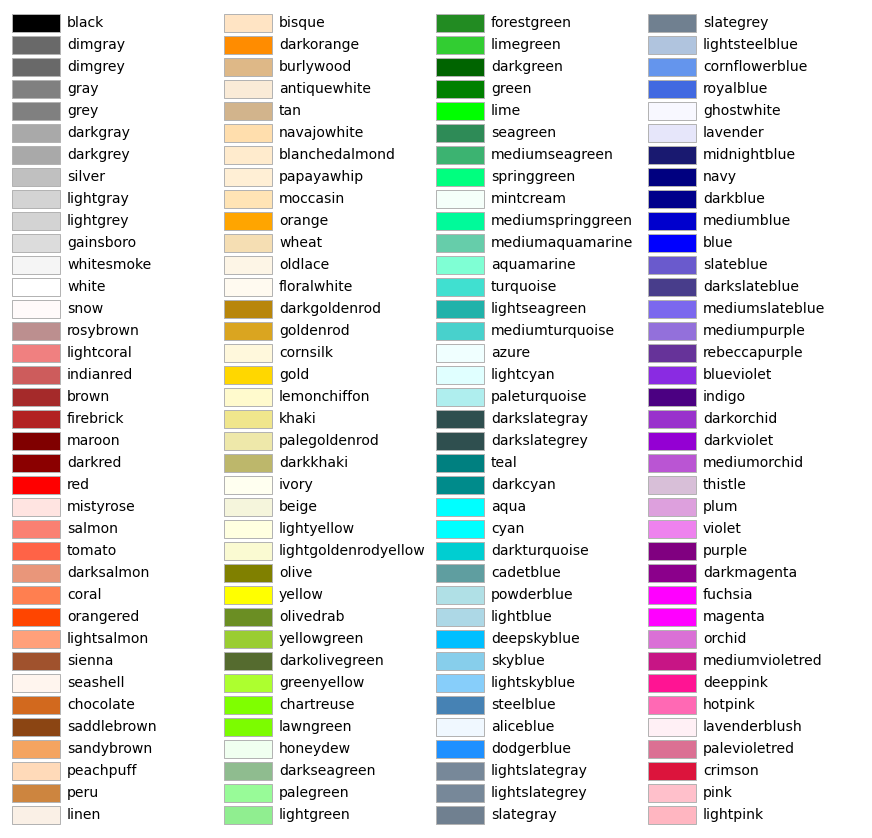
CSS 颜色#
plot_colortable(mcolors.CSS4_COLORS)
plt.show()
XKCD 颜色#
Matplotlib 支持来自 xkcd color survey 的颜色,例如 "xkcd:sky blue" .由于这包含近 1000 种颜色,因此此图形将非常大,因此此处省略.您可以使用以下代码自己生成概述
xkcd_fig = plot_colortable(mcolors.XKCD_COLORS)
xkcd_fig.savefig("XKCD_Colors.png")
参考
以下函数,方法,类和模块的用法在本例中显示:
matplotlib.colorsmatplotlib.colors.rgb_to_hsvmatplotlib.colors.to_rgbamatplotlib.figure.Figure.get_size_inchesmatplotlib.figure.Figure.subplots_adjustmatplotlib.axes.Axes.textmatplotlib.patches.Rectangle