备注
Go to the end 下载完整的示例代码.
日期刻度定位器和格式化器#
此示例说明了各种日期定位器和格式化器的用法和效果.
import matplotlib.pyplot as plt
import numpy as np

from matplotlib.dates import (FR, MO, MONTHLY, SA, SU, TH, TU, WE,
                              AutoDateFormatter, AutoDateLocator,
                              ConciseDateFormatter, DateFormatter, DayLocator,
                              HourLocator, MicrosecondLocator, MinuteLocator,
                              MonthLocator, RRuleLocator, SecondLocator,
                              WeekdayLocator, YearLocator, rrulewrapper)
import matplotlib.ticker as ticker


def plot_axis(ax, locator=None, xmax='2002-02-01', fmt=None, formatter=None):
    """Set up common parameters for the Axes in the example."""
    ax.spines[['left', 'right', 'top']].set_visible(False)
    ax.yaxis.set_major_locator(ticker.NullLocator())
    ax.tick_params(which='major', width=1.00, length=5)
    ax.tick_params(which='minor', width=0.75, length=2.5)
    ax.set_xlim(np.datetime64('2000-02-01'), np.datetime64(xmax))
    if locator:
        ax.xaxis.set_major_locator(eval(locator))
        ax.xaxis.set_major_formatter(DateFormatter(fmt))
    else:
        ax.xaxis.set_major_formatter(eval(formatter))
    ax.text(0.0, 0.2, locator or formatter, transform=ax.transAxes,
            fontsize=14, fontname='Monospace', color='tab:blue')
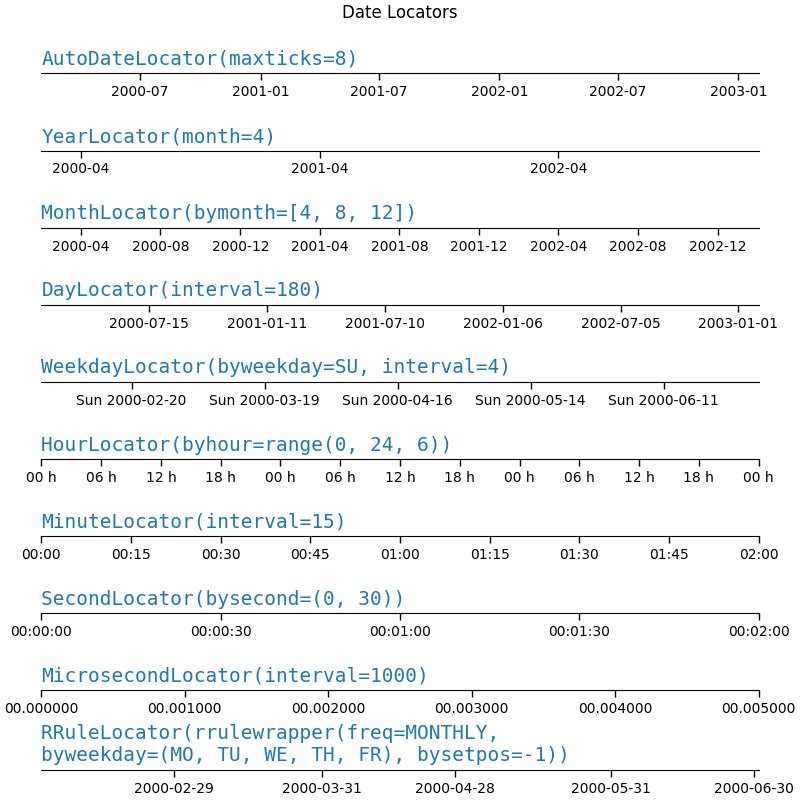
date-locators#
locators = [
    # locator as str, xmax, fmt
    ('AutoDateLocator(maxticks=8)', '2003-02-01', '%Y-%m'),
    ('YearLocator(month=4)', '2003-02-01', '%Y-%m'),
    ('MonthLocator(bymonth=[4, 8, 12])', '2003-02-01', '%Y-%m'),
    ('DayLocator(interval=180)', '2003-02-01', '%Y-%m-%d'),
    ('WeekdayLocator(byweekday=SU, interval=4)', '2000-07-01', '%a %Y-%m-%d'),
    ('HourLocator(byhour=range(0, 24, 6))', '2000-02-04', '%H h'),
    ('MinuteLocator(interval=15)', '2000-02-01 02:00', '%H:%M'),
    ('SecondLocator(bysecond=(0, 30))', '2000-02-01 00:02', '%H:%M:%S'),
    ('MicrosecondLocator(interval=1000)', '2000-02-01 00:00:00.005', '%S.%f'),
    ('RRuleLocator(rrulewrapper(freq=MONTHLY, \nbyweekday=(MO, TU, WE, TH, FR), '
     'bysetpos=-1))', '2000-07-01', '%Y-%m-%d'),
]

fig, axs = plt.subplots(len(locators), 1, figsize=(8, len(locators) * .8),
                        layout='constrained')
fig.suptitle('Date Locators')
for ax, (locator, xmax, fmt) in zip(axs, locators):
    plot_axis(ax, locator, xmax, fmt)
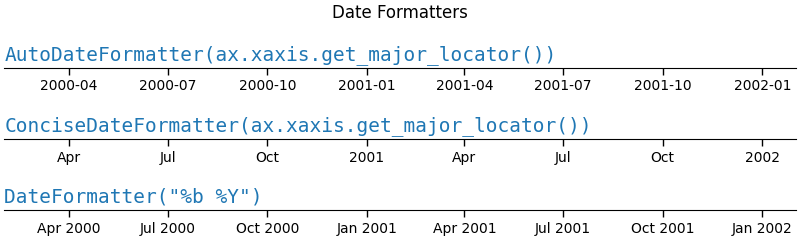
date-formatters#
formatters = [
    'AutoDateFormatter(ax.xaxis.get_major_locator())',
    'ConciseDateFormatter(ax.xaxis.get_major_locator())',
    'DateFormatter("%b %Y")',
]

fig, axs = plt.subplots(len(formatters), 1, figsize=(8, len(formatters) * .8),
                        layout='constrained')
fig.suptitle('Date Formatters')
for ax, fmt in zip(axs, formatters):
    plot_axis(ax, formatter=fmt)
参考
以下函数,方法,类和模块的用法在本例中显示:
matplotlib.dates.AutoDateLocatormatplotlib.dates.YearLocatormatplotlib.dates.MonthLocatormatplotlib.dates.DayLocatormatplotlib.dates.WeekdayLocatormatplotlib.dates.HourLocatormatplotlib.dates.MinuteLocatormatplotlib.dates.SecondLocatormatplotlib.dates.MicrosecondLocatormatplotlib.dates.RRuleLocatormatplotlib.dates.rrulewrappermatplotlib.dates.DateFormattermatplotlib.dates.AutoDateFormattermatplotlib.dates.ConciseDateFormatter
脚本总运行时间:(0 分 1.960 秒)