备注
Go to the end 下载完整示例代码.
使用关键字绘图#
一些数据结构,例如 dict, structured numpy array 或 pandas.DataFrame 提供通过字符串索引访问 data[key] 来访问带标签的数据.
对于这些数据类型,Matplotlib 支持通过 data 关键字参数传递整个数据结构,并使用字符串名称作为绘图函数参数,您通常会在其中传入数据.
import matplotlib.pyplot as plt
import numpy as np
np.random.seed(19680801)
data = {'a': np.arange(50),
'c': np.random.randint(0, 50, 50),
'd': np.random.randn(50)}
data['b'] = data['a'] + 10 * np.random.randn(50)
data['d'] = np.abs(data['d']) * 100
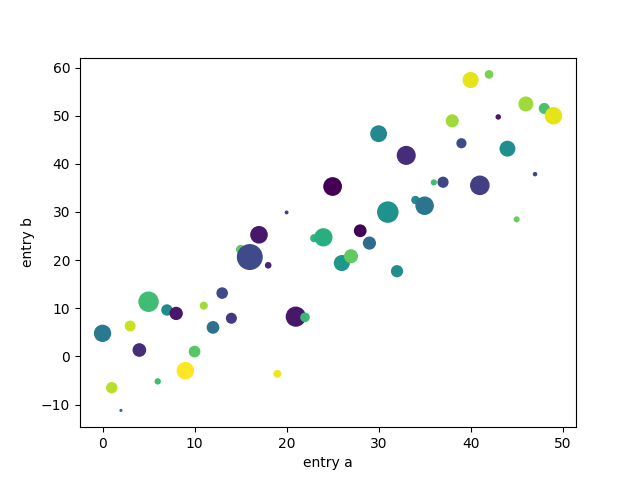
fig, ax = plt.subplots()
ax.scatter('a', 'b', c='c', s='d', data=data)
ax.set(xlabel='entry a', ylabel='entry b')
plt.show()