备注
Go to the end 下载完整示例代码.
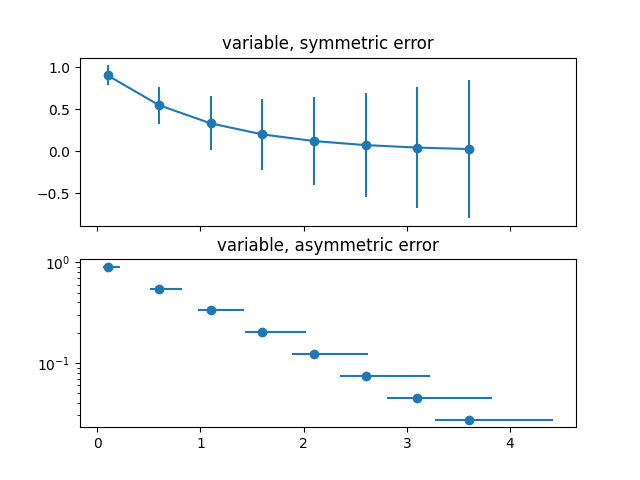
指定误差棒的不同方式#
误差可以指定为常数值(如 误差线函数 中所示). 但是,此示例演示了如何通过指定误差值数组来使它们变化.
如果原始 x 和 y 数据的长度为 N,则有两种选择:
- 形状为 (N,) 的数组:
每个点的误差都不同,但误差值是对称的(即,下限值和上限值相等).
- 形状为 (2, N) 的数组:
每个点的误差都不同,并且下限和上限(按此顺序排列)不同(非对称情况).
此外,此示例演示了如何在误差线中使用对数刻度.
import matplotlib.pyplot as plt
import numpy as np

# example data
x = np.arange(0.1, 4, 0.5)
y = np.exp(-x)

# example error bar values that vary with x-position
error = 0.1 + 0.2 * x

fig, (ax0, ax1) = plt.subplots(nrows=2, sharex=True)
ax0.errorbar(x, y, yerr=error, fmt='-o')
ax0.set_title('variable, symmetric error')

# error bar values w/ different -/+ errors that
# also vary with the x-position
lower_error = 0.4 * error
upper_error = error
asymmetric_error = [lower_error, upper_error]

ax1.errorbar(x, y, xerr=asymmetric_error, fmt='o')
ax1.set_title('variable, asymmetric error')
ax1.set_yscale('log')
plt.show()
参考
以下函数,方法,类和模块的用法在本例中显示:
matplotlib.axes.Axes.errorbar/matplotlib.pyplot.errorbar