备注
Go to the end 来下载完整的示例代码.
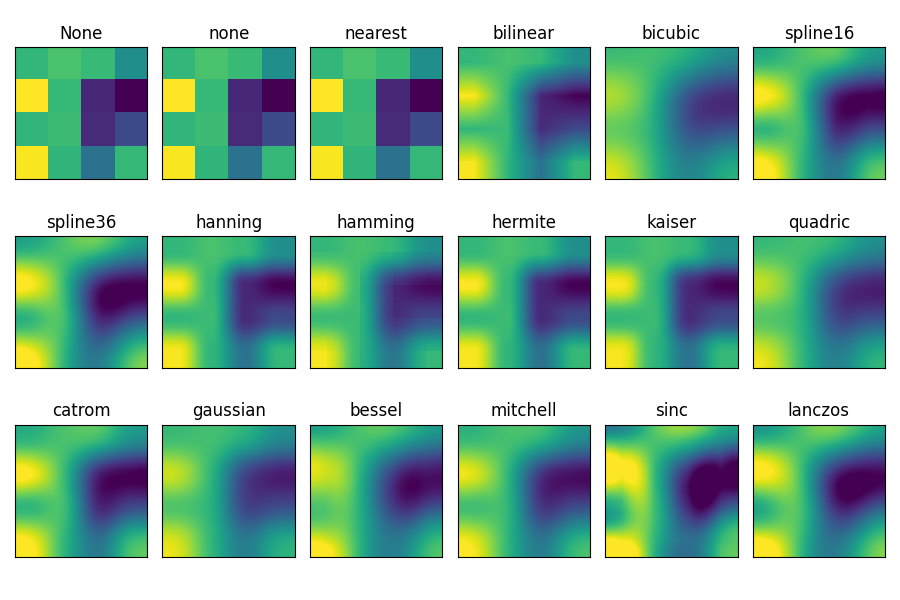
imshow 的插值方法#
此示例展示了 imshow 的插值方法之间的区别.
如果 interpolation 为 None,则默认为 rcParams["image.interpolation"] (default: 'auto') .如果 interpolation 为 'none' ,则 Agg,ps 和 pdf 后端不会执行任何插值.其他后端将默认为 'auto' .
对于 Agg,ps 和 pdf 后端,当大图像缩小时, interpolation='none' 效果良好,而当小图像放大时, interpolation='nearest' 效果良好.
有关默认的 interpolation='auto' 选项的讨论,请参见 图像重采样 .
import matplotlib.pyplot as plt
import numpy as np

methods = [None, 'none', 'nearest', 'bilinear', 'bicubic', 'spline16',
           'spline36', 'hanning', 'hamming', 'hermite', 'kaiser', 'quadric',
           'catrom', 'gaussian', 'bessel', 'mitchell', 'sinc', 'lanczos']

# Fixing random state for reproducibility
np.random.seed(19680801)

grid = np.random.rand(4, 4)

fig, axs = plt.subplots(nrows=3, ncols=6, figsize=(9, 6),
                        subplot_kw={'xticks': [], 'yticks': []})

for ax, interp_method in zip(axs.flat, methods):
    ax.imshow(grid, interpolation=interp_method, cmap='viridis')
    ax.set_title(str(interp_method))

plt.tight_layout()
plt.show()
参考
以下函数,方法,类和模块的用法在本例中显示:
matplotlib.axes.Axes.imshow/matplotlib.pyplot.imshow
脚本的总运行时间:(0 分 1.505 秒)