备注
Go to the end 以下载完整的示例代码.
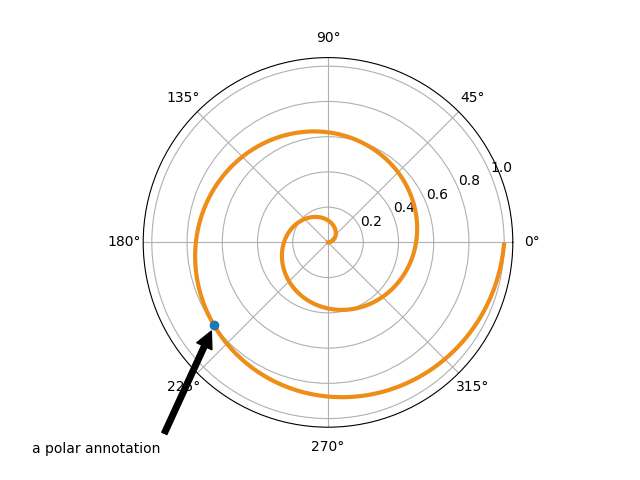
注释极坐标图#
此示例展示了如何在极坐标图上创建注释.
要获得注释功能的完整概述,另请参见 注释 .
import matplotlib.pyplot as plt
import numpy as np

fig = plt.figure()
ax = fig.add_subplot(projection='polar')
r = np.arange(0, 1, 0.001)
theta = 2 * 2*np.pi * r
line, = ax.plot(theta, r, color='#ee8d18', lw=3)

ind = 800
thisr, thistheta = r[ind], theta[ind]
ax.plot([thistheta], [thisr], 'o')
ax.annotate('a polar annotation',
            xy=(thistheta, thisr),  # theta, radius
            xytext=(0.05, 0.05),    # fraction, fraction
            textcoords='figure fraction',
            arrowprops=dict(facecolor='black', shrink=0.05),
            horizontalalignment='left',
            verticalalignment='bottom',
            )
plt.show()
参考
以下函数,方法,类和模块的用法在本例中显示:
matplotlib.projections.polarmatplotlib.axes.Axes.annotate/matplotlib.pyplot.annotate