备注
Go to the end 下载完整的示例代码.
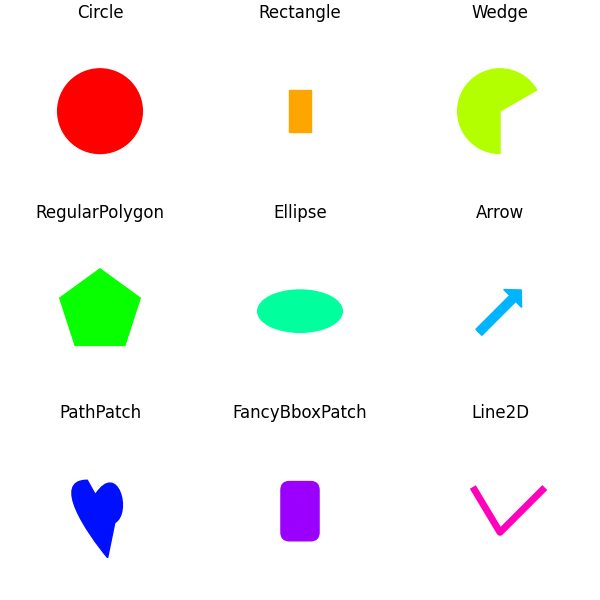
Matplotlib artists 参考#
此示例显示了 Matplotlib 的几个图形基元(artists).artists 的完整列表记录在 the artist API .
另请参见 圆,楔和多边形 ,它将所有 artists 分组到一个 PatchCollection 中.
版权所有 (c) 2010, Bartosz Telenczuk BSD 许可证
import matplotlib.pyplot as plt

import matplotlib as mpl
import matplotlib.lines as mlines
import matplotlib.patches as mpatches
import matplotlib.path as mpath

# Prepare the data for the PathPatch below.
Path = mpath.Path
codes, verts = zip(*[
    (Path.MOVETO, [0.018, -0.11]),
    (Path.CURVE4, [-0.031, -0.051]),
    (Path.CURVE4, [-0.115, 0.073]),
    (Path.CURVE4, [-0.03, 0.073]),
    (Path.LINETO, [-0.011, 0.039]),
    (Path.CURVE4, [0.043, 0.121]),
    (Path.CURVE4, [0.075, -0.005]),
    (Path.CURVE4, [0.035, -0.027]),
    (Path.CLOSEPOLY, [0.018, -0.11])])

artists = [
    mpatches.Circle((0, 0), 0.1, ec="none"),
    mpatches.Rectangle((-0.025, -0.05), 0.05, 0.1, ec="none"),
    mpatches.Wedge((0, 0), 0.1, 30, 270, ec="none"),
    mpatches.RegularPolygon((0, 0), 5, radius=0.1),
    mpatches.Ellipse((0, 0), 0.2, 0.1),
    mpatches.Arrow(-0.05, -0.05, 0.1, 0.1, width=0.1),
    mpatches.PathPatch(mpath.Path(verts, codes), ec="none"),
    mpatches.FancyBboxPatch((-0.025, -0.05), 0.05, 0.1, ec="none",
                            boxstyle=mpatches.BoxStyle("Round", pad=0.02)),
    mlines.Line2D([-0.06, 0.0, 0.1], [0.05, -0.05, 0.05], lw=5),
]

axs = plt.figure(figsize=(6, 6), layout="constrained").subplots(3, 3)
for i, (ax, artist) in enumerate(zip(axs.flat, artists)):
    artist.set(color=mpl.colormaps["hsv"](i / len(artists)))
    ax.add_artist(artist)
    ax.set(title=type(artist).__name__,
           aspect=1, xlim=(-.2, .2), ylim=(-.2, .2))
    ax.set_axis_off()
plt.show()
参考
以下函数,方法,类和模块的用法在本例中显示:
matplotlib.pathmatplotlib.path.Pathmatplotlib.linesmatplotlib.lines.Line2Dmatplotlib.patchesmatplotlib.patches.Circlematplotlib.patches.Ellipsematplotlib.patches.Wedgematplotlib.patches.Rectanglematplotlib.patches.Arrowmatplotlib.patches.PathPatchmatplotlib.patches.FancyBboxPatchmatplotlib.patches.RegularPolygonmatplotlib.axes.Axes.add_artist