备注
Go to the end 下载完整的示例代码.
自动设置刻度位置#
设置刻度自动放置的行为.
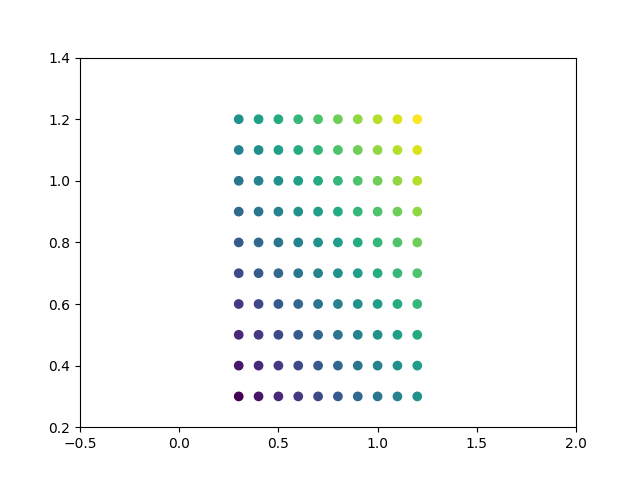
默认情况下,Matplotlib 将选择刻度的数量和刻度位置,以便轴上有合理数量的刻度,并且它们位于"圆形"数字处.
因此,绘图边缘可能没有刻度.
import matplotlib.pyplot as plt
import numpy as np

np.random.seed(19680801)

fig, ax = plt.subplots()
dots = np.linspace(0.3, 1.2, 10)
X, Y = np.meshgrid(dots, dots)
x, y = X.ravel(), Y.ravel()
ax.scatter(x, y, c=x+y)
plt.show()
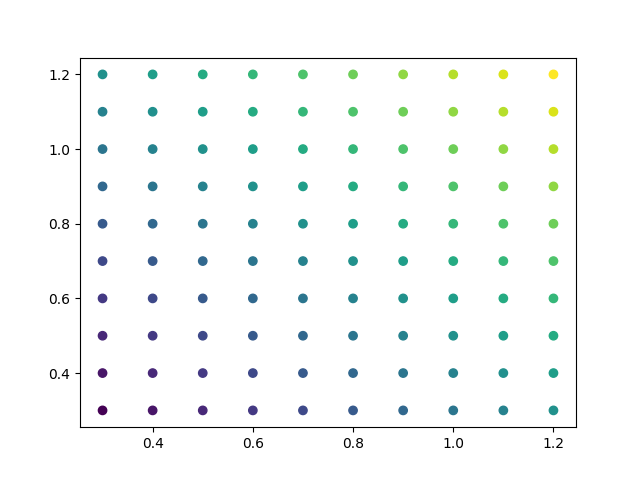
如果希望保持刻度为圆形数字,并且在边缘也有刻度,则可以将 rcParams["axes.autolimit_mode"] (default: 'data') 切换为 'round_numbers'. 这会将轴限制扩展到下一个圆形数字.
plt.rcParams['axes.autolimit_mode'] = 'round_numbers'

# Note: The limits are calculated at draw-time. Therefore, when using
# :rc:`axes.autolimit_mode` in a context manager, it is important that
# the ``show()`` command is within the context.

fig, ax = plt.subplots()
ax.scatter(x, y, c=x+y)
plt.show()
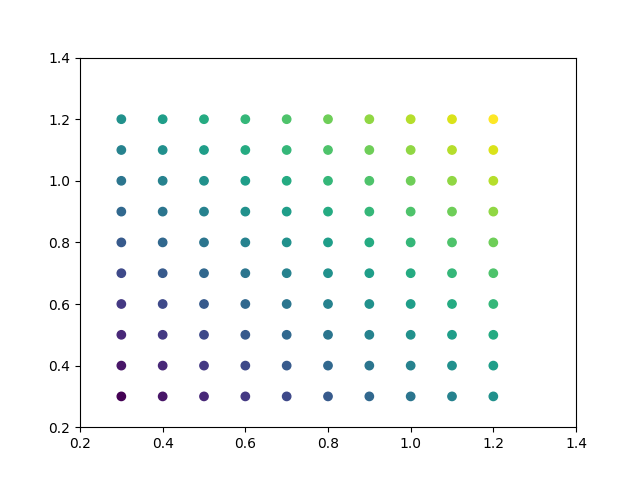
如果使用 Axes.set_xmargin / Axes.set_ymargin 在数据周围设置额外的边距,那么 round numbers autolimit_mode 仍然有效:
fig, ax = plt.subplots()
ax.scatter(x, y, c=x+y)
ax.set_xmargin(0.8)
plt.show()