备注
Go to the end 下载完整的示例代码.
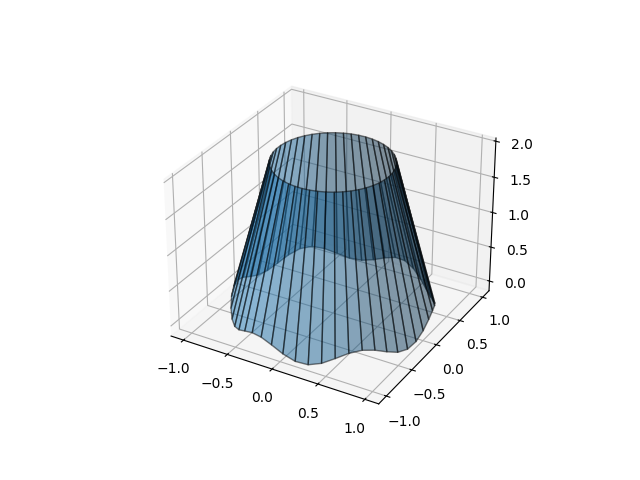
填充 3D 线之间的区域#
演示如何使用曲面填充 3D 线之间的空间. 在这里,我们创建了一种"灯罩"形状.
import matplotlib.pyplot as plt
import numpy as np

N = 50
theta = np.linspace(0, 2*np.pi, N)

x1 = np.cos(theta)
y1 = np.sin(theta)
z1 = 0.1 * np.sin(6 * theta)

x2 = 0.6 * np.cos(theta)
y2 = 0.6 * np.sin(theta)
z2 = 2  # Note that scalar values work in addition to length N arrays

fig = plt.figure()
ax = fig.add_subplot(projection='3d')
ax.fill_between(x1, y1, z1, x2, y2, z2, alpha=0.5, edgecolor='k')

plt.show()