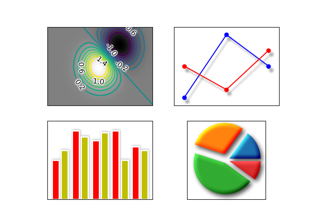
示例
有关我们提供的绘图方法的概述,请参阅 绘图类型
此页面包含示例图.单击任何图像以查看完整图像和源代码.
有关更长的教程,请参阅我们的 tutorials page .您还可以在我们的 external resources 中找到 FAQ 和 user guide .
线条,条形和标记
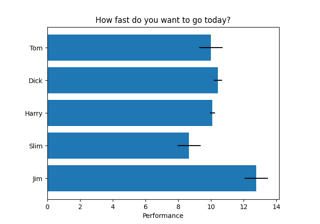
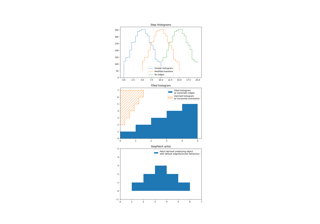
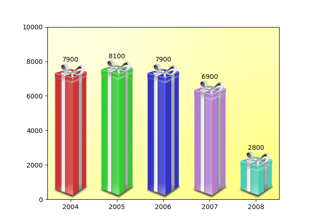
水平柱状图
Horizontal bar chart
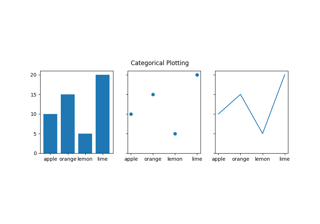
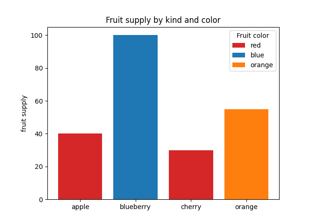
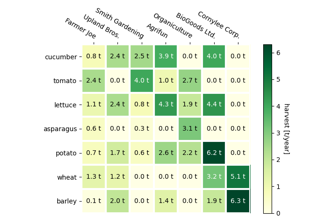
绘制分类变量
Plotting categorical variables
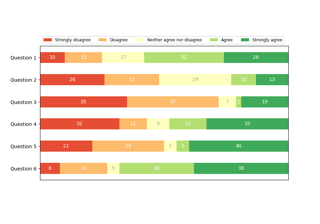
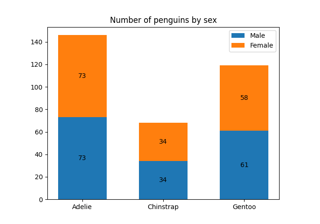
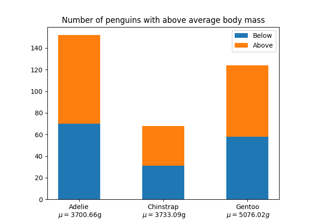
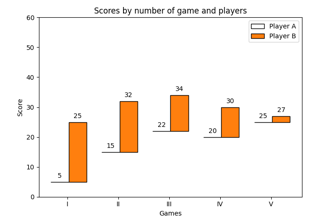
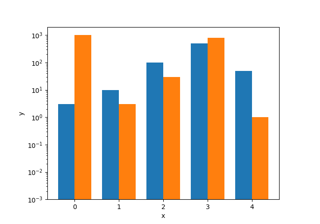
离散分布作为水平条形图
Discrete distribution as horizontal bar chart
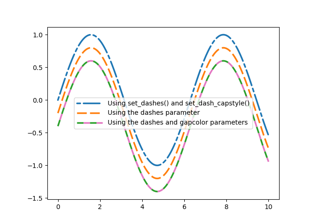
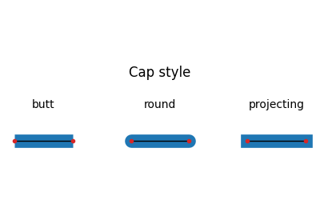
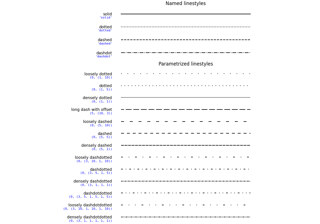
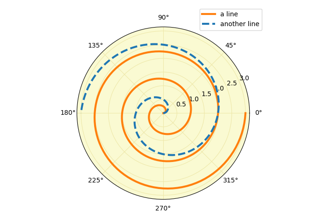
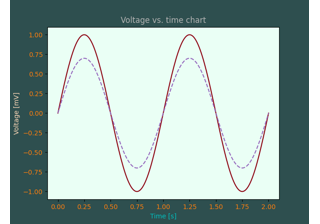
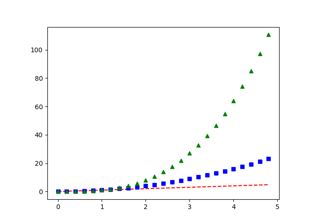
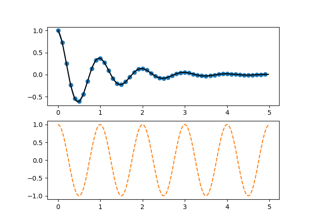
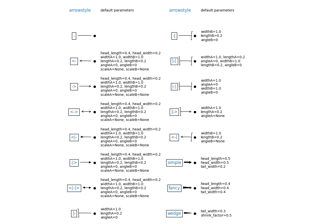
虚线样式配置
Dashed line style configuration
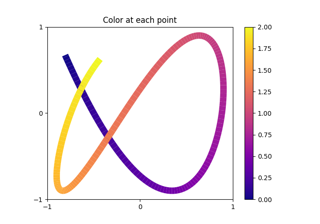
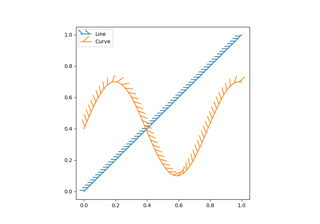
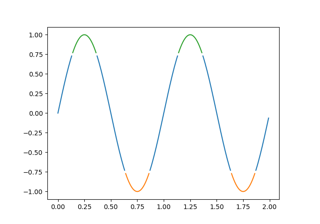
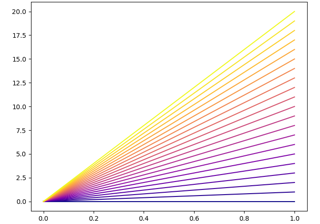
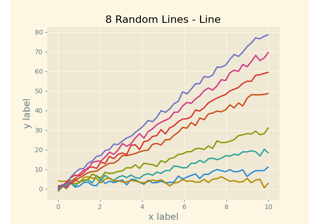
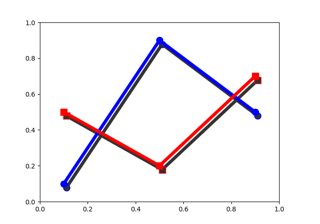
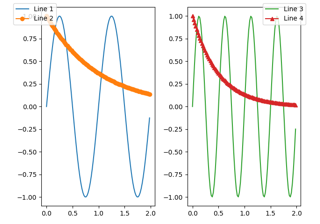
多色线条
Multicolored lines

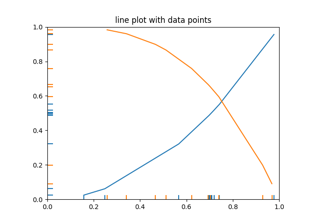
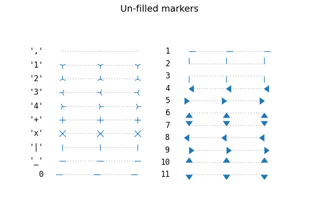
标记示例
Marker examples
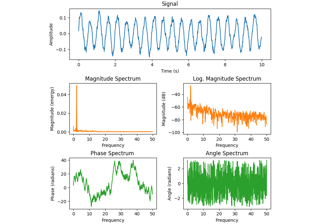
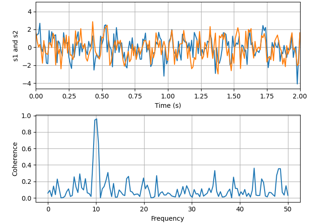
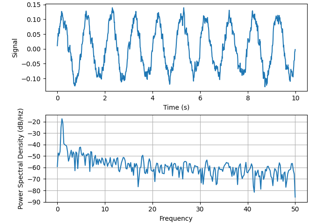
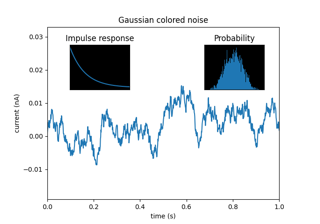
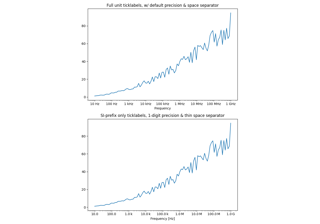
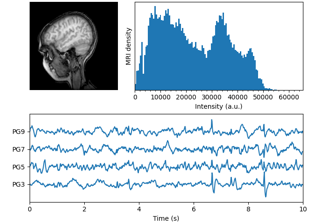
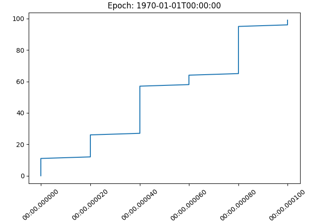
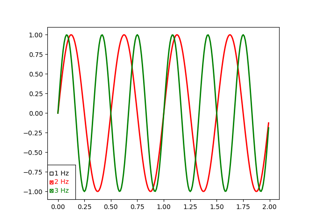
频谱表示
Spectrum representations
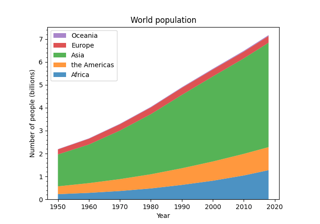
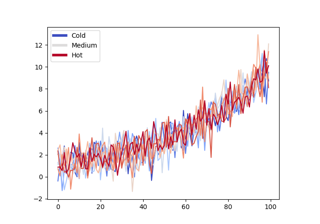
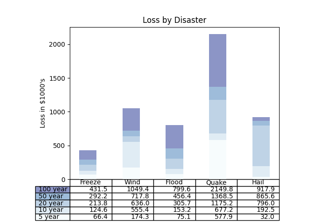
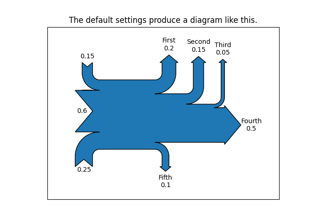
堆叠图和流图
Stackplots and streamgraphs
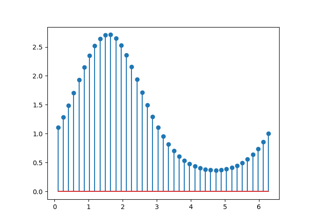
茎图
Stem plot
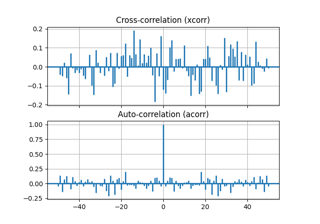
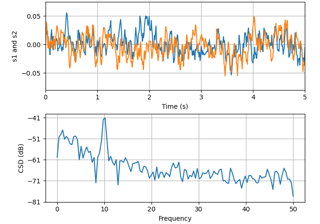
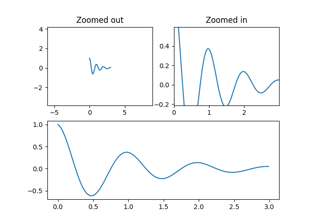
互相关和自相关
Cross- and auto-correlation
图像,轮廓和场

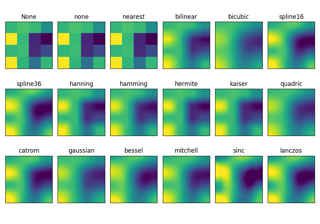
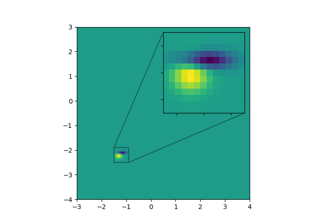
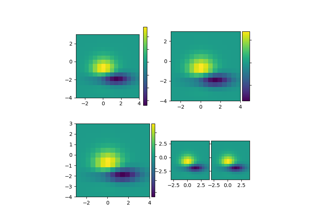
图像的仿射变换
Affine transform of an image
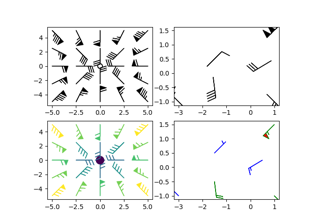
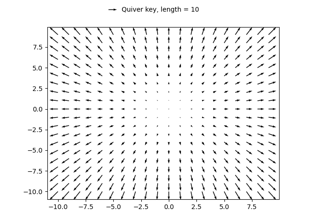
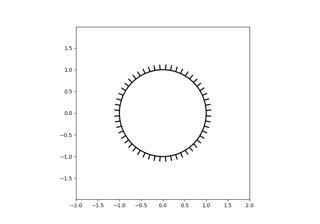
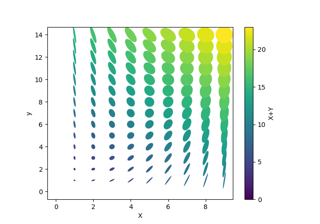
风羽
Wind barbs
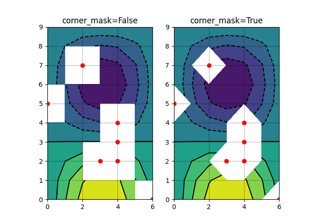
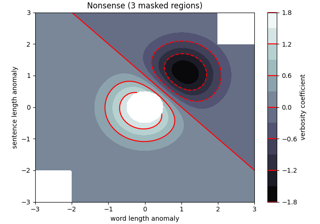
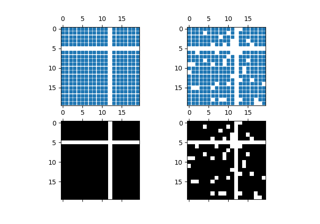
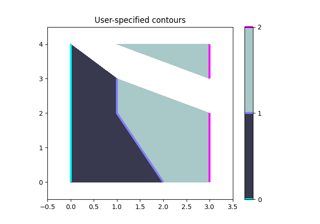
轮廓角掩模
Contour corner mask
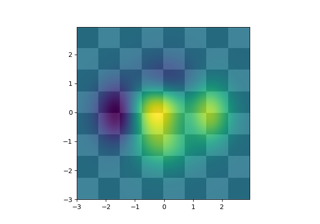
用补丁裁剪图像
Clipping images with patches
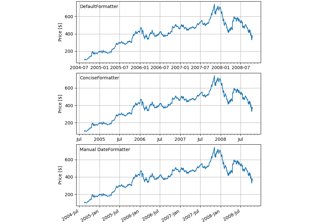
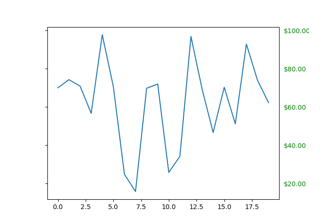
修改坐标格式化器
Modifying the coordinate formatter
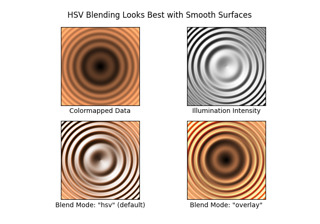
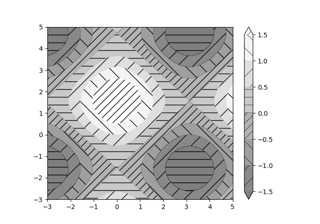
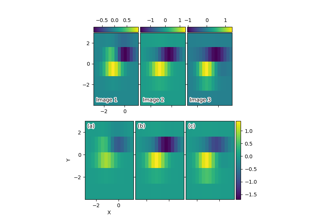
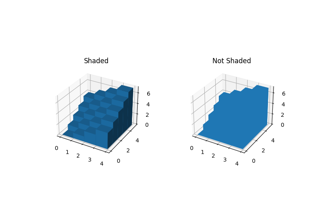
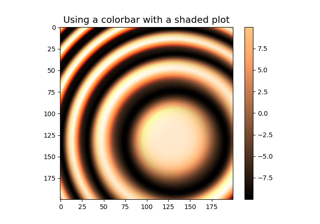
阴影示例
Shading example
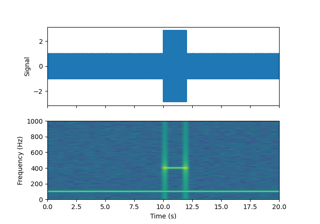
声谱图
Spectrogram

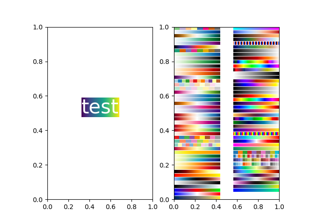
水印图像
Watermark image
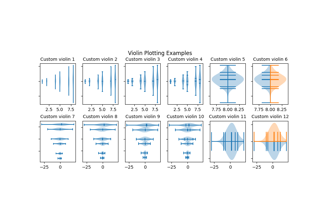
统计
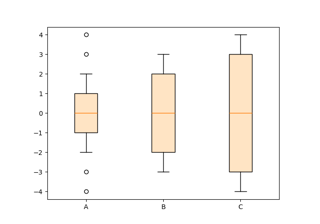
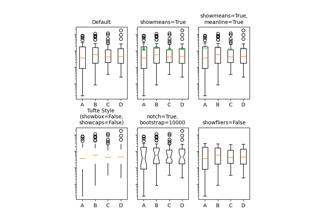
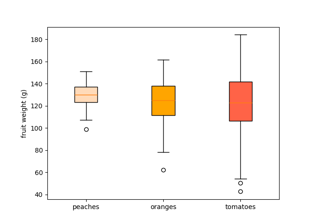
箱线图的单独计算和绘图
Separate calculation and plotting of boxplots
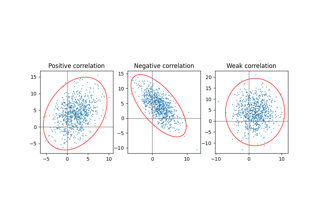
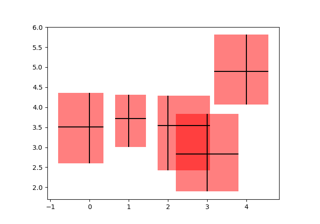
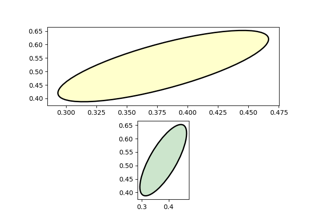
绘制二维数据集的置信椭圆
Plot a confidence ellipse of a two-dimensional dataset
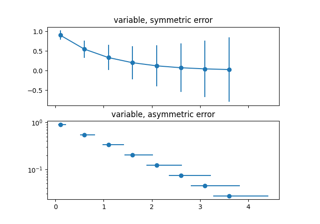
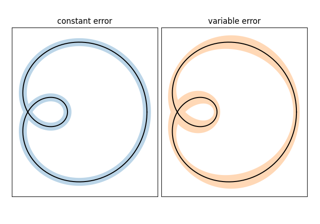
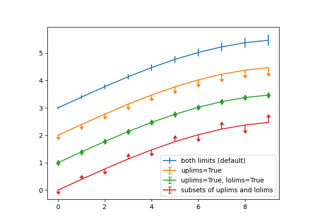
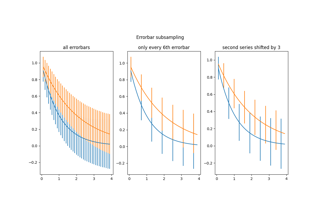
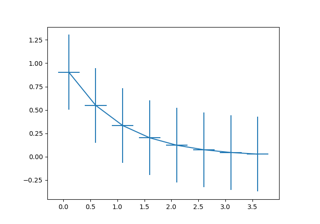
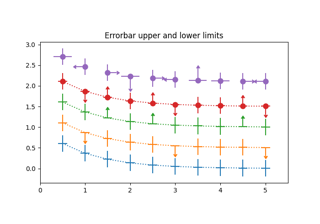
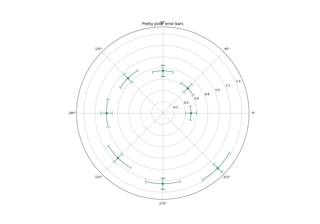
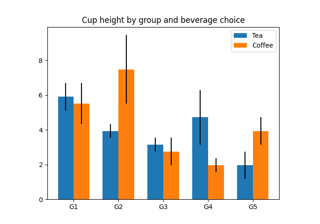
指定误差棒的不同方式
Different ways of specifying error bars
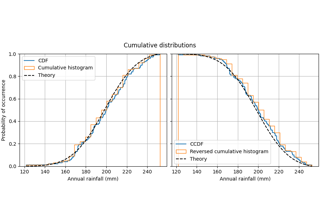
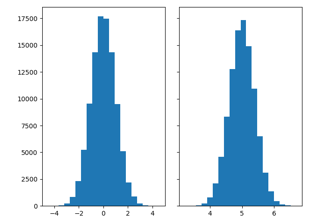
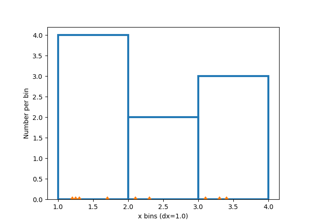
累积分布
Cumulative distributions
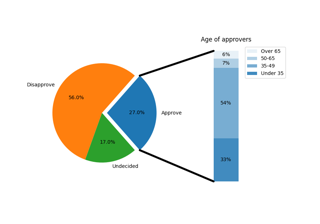
饼图和极坐标图
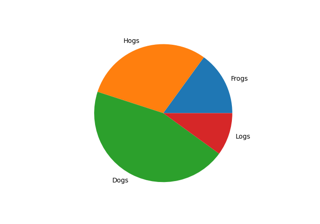
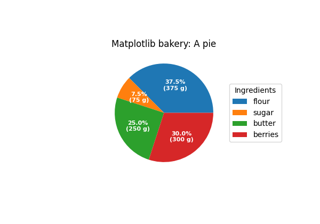
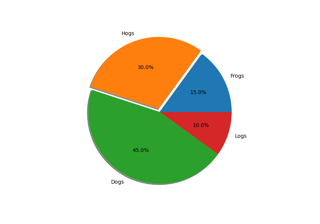
饼图
Pie charts
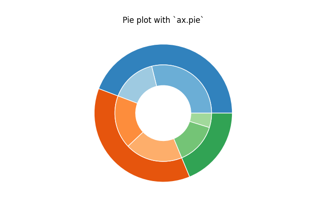
嵌套饼图
Nested pie charts
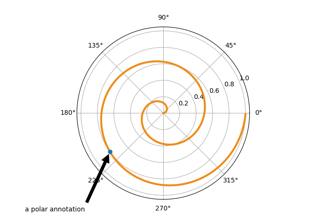
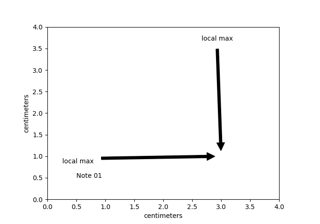
文本,标签和注释
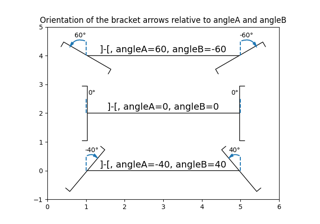
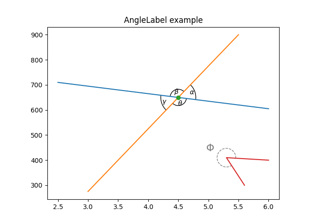
括号箭头的角度注释
Angle annotations on bracket arrows
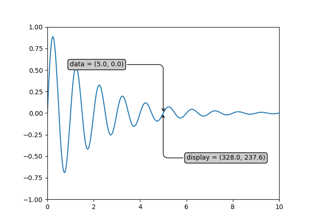
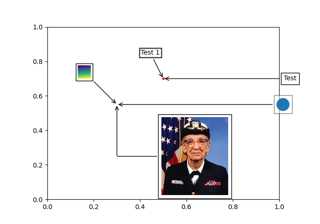
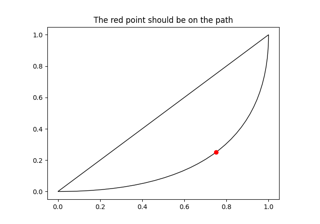
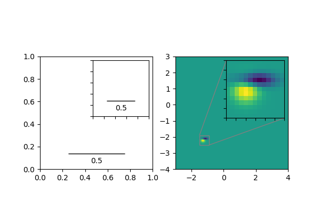
注释变换
Annotate transform
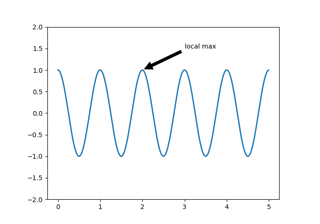
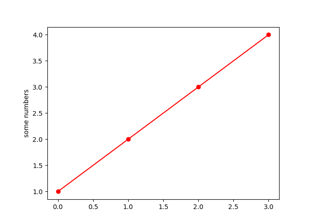
注释绘图
Annotating a plot
注释箭头样式参考
Annotation arrow style reference
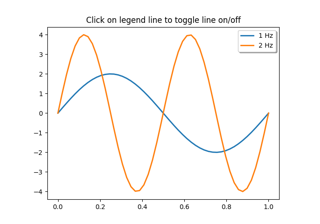
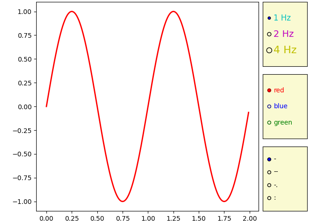
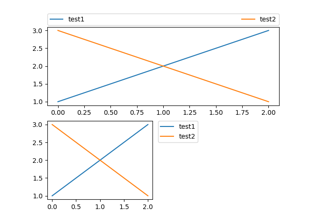
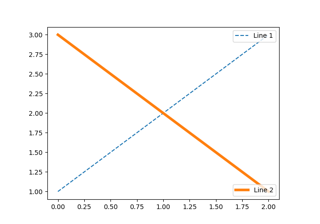
图例演示
Figure legend demo
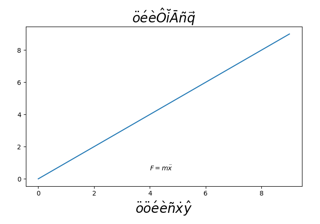
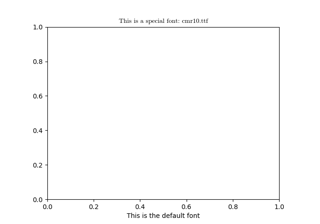
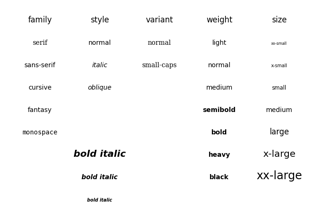
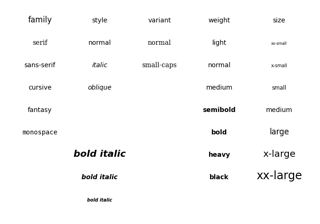
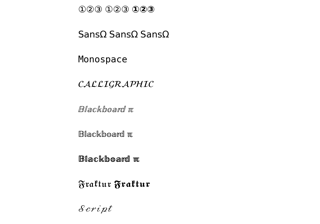
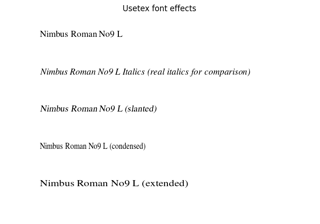
配置字体族
Configure the font family
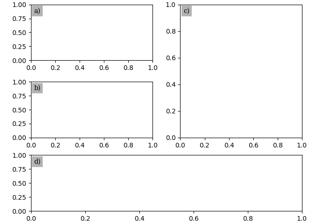
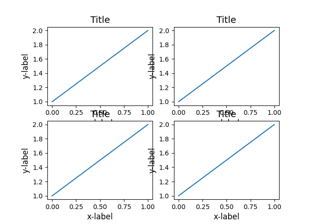
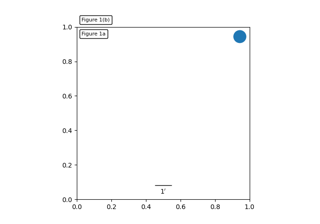
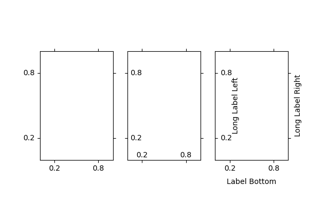
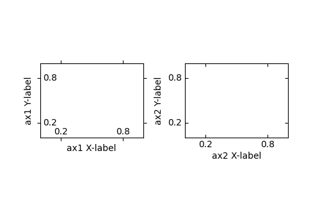
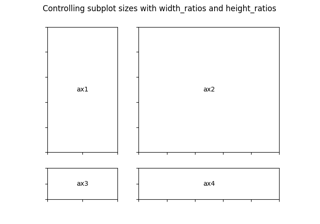
标记子图
Labelling subplots
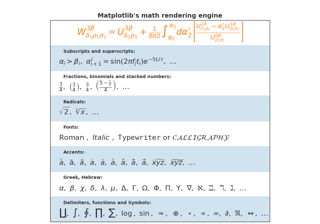
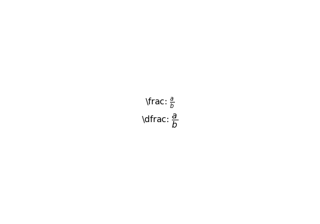
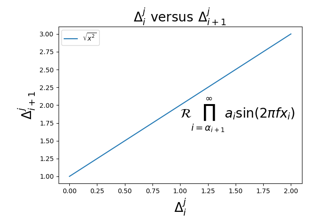
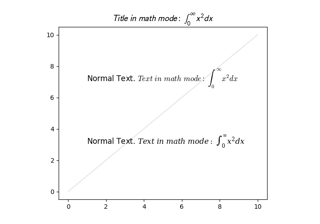
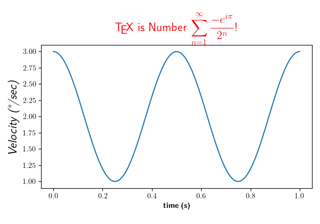
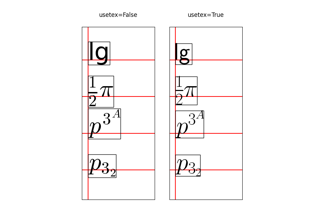
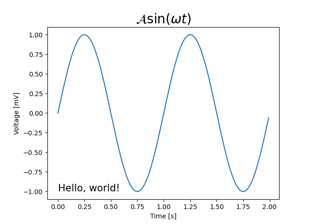
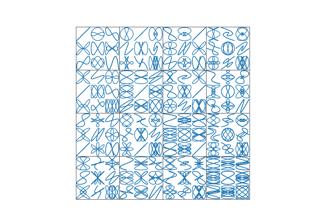
数学表达式
Mathematical expressions
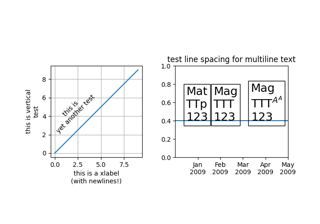
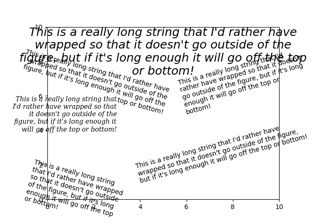
多行
Multiline
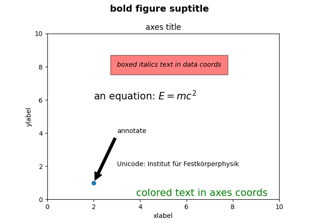
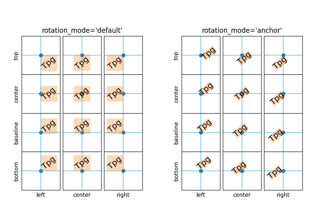
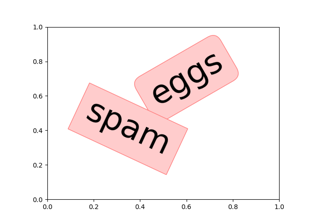
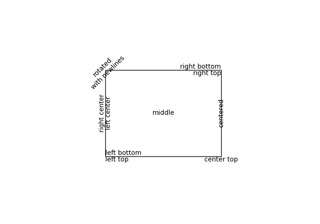
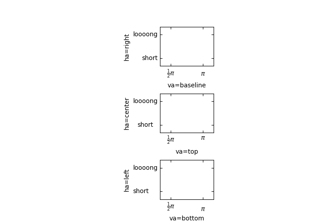
文本属性
Text properties

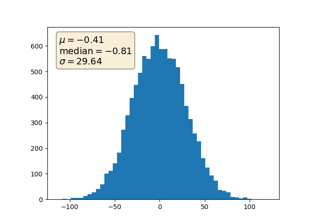
使用字典控制文本和标签的样式
Controlling style of text and labels using a dictionary
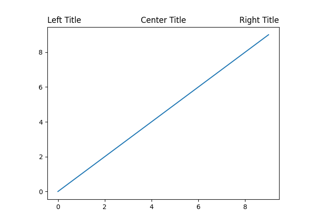
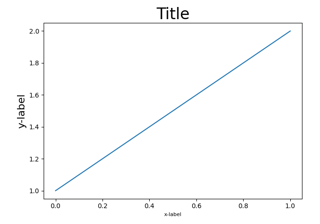
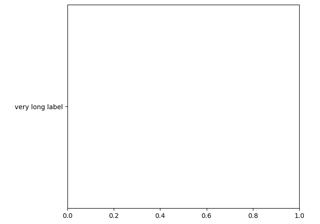
标题定位
Title positioning
形状和集合
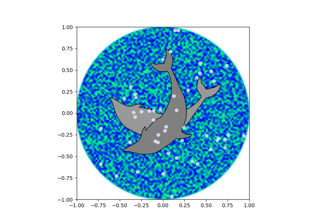
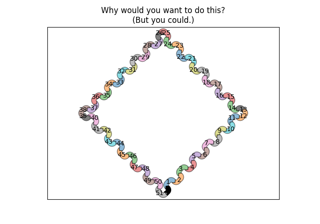
海豚
Dolphins
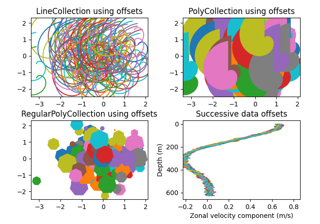
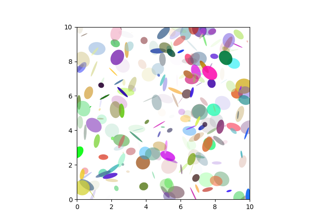
椭圆集合
Ellipse Collection
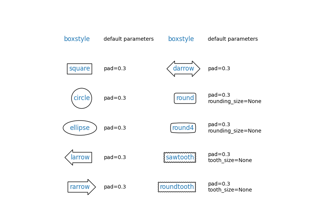
绘制花式框
Drawing fancy boxes
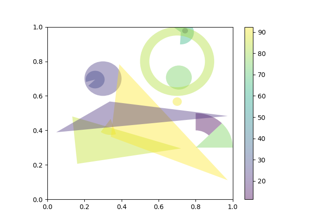
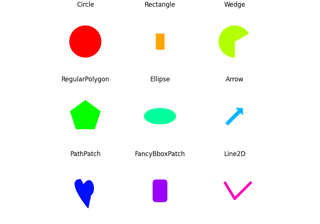
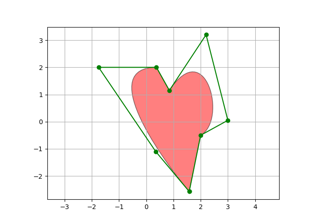
圆,楔和多边形
Circles, Wedges and Polygons
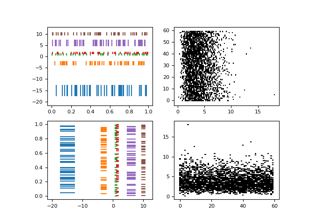
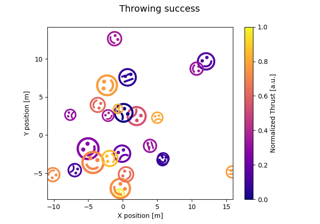
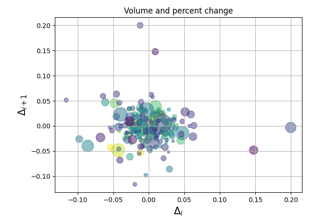
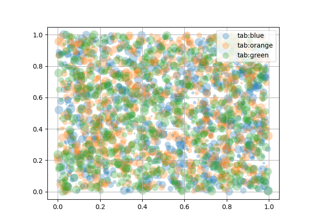
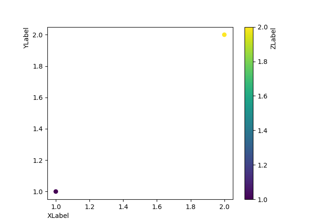
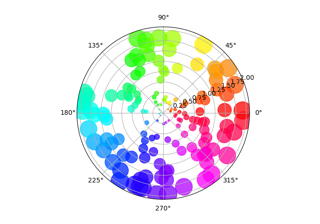
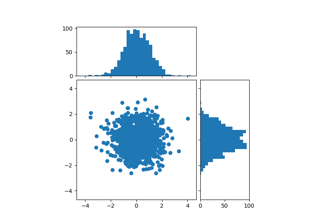
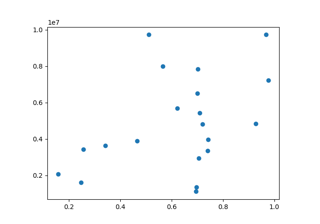
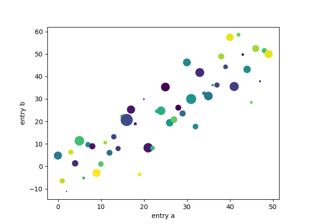
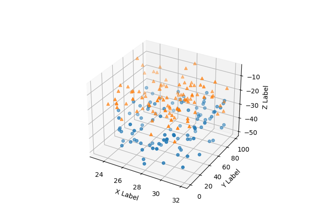
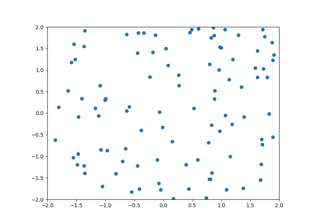
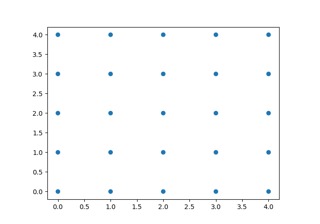
散点图
Scatter plot
样式表
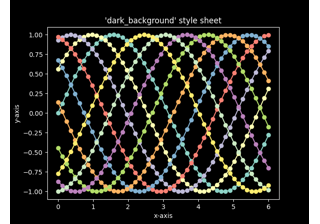
深色背景样式表
Dark background style sheet
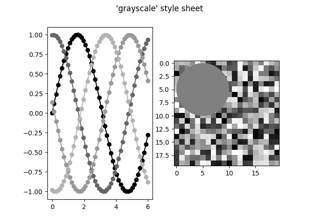
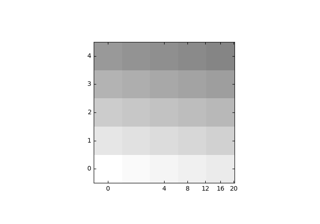
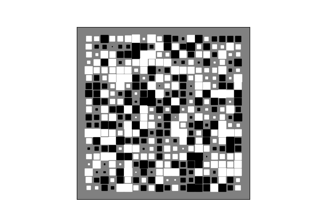
灰度样式表
Grayscale style sheet
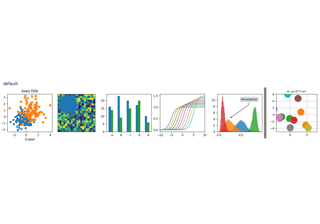
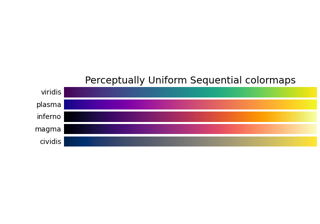
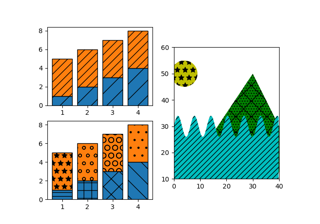
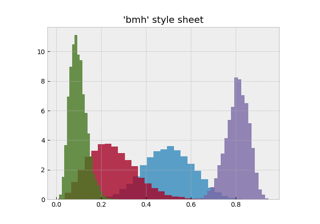
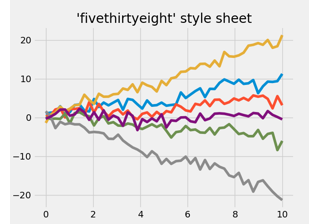
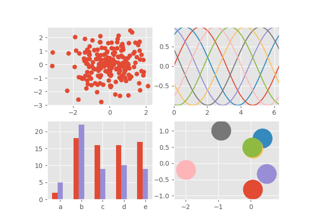
样式表参考
Style sheets reference
模块 - pyplot
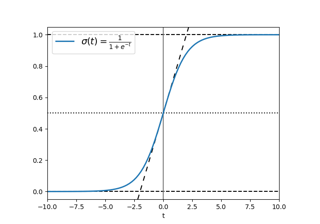
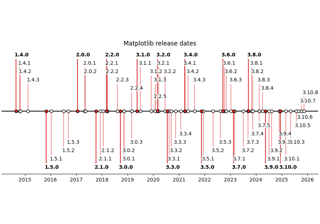
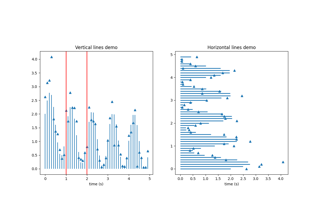
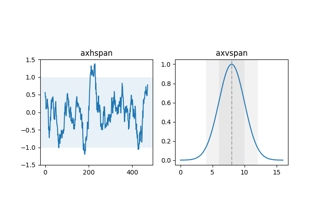
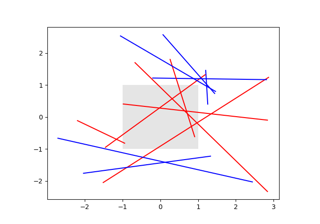
无限线
Infinite lines
模块 - axes_grid1
锚定方向箭头
Anchored Direction Arrow
模块 - axisartist
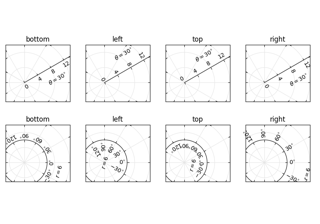
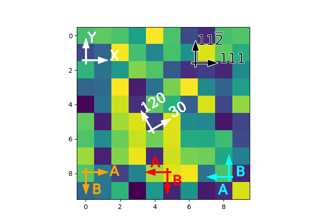
轴方向
Axis Direction
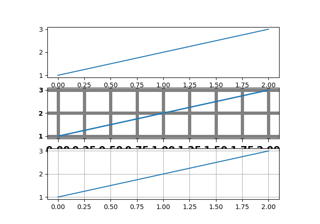
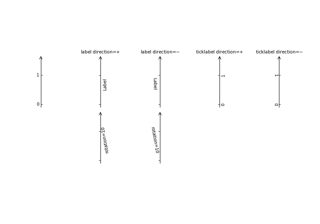
轴线样式
Axis line styles
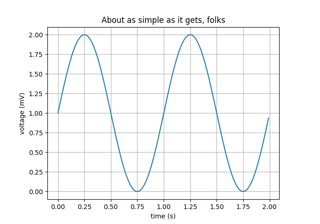
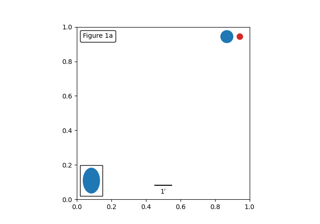
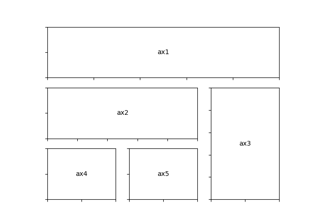
展示

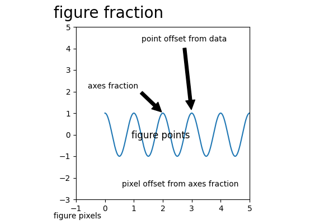
图形的解剖
Anatomy of a figure
动画
双摆问题
The double pendulum problem

帧抓取
Frame grabbing
多轴动画
Multiple Axes animation
暂停和恢复动画
Pause and resume an animation

雨滴模拟
Rain simulation
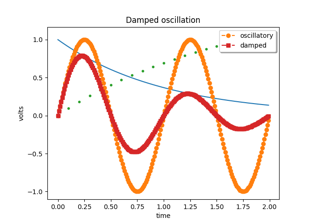
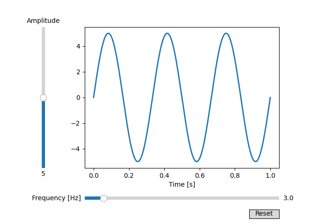
示波器
Oscilloscope
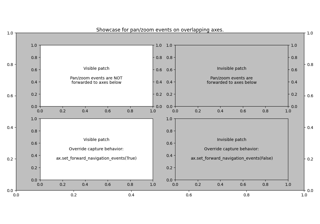
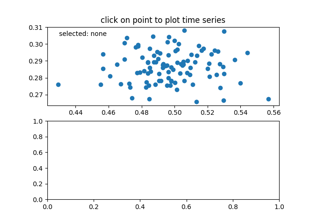
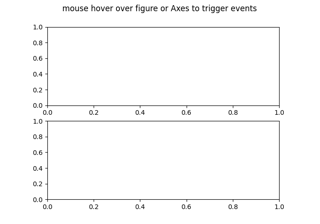
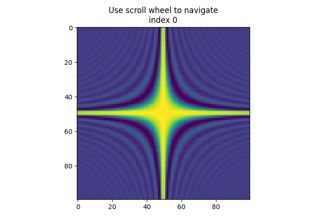
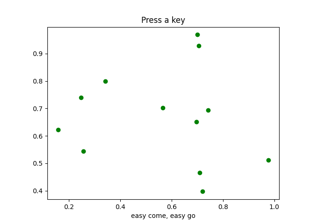
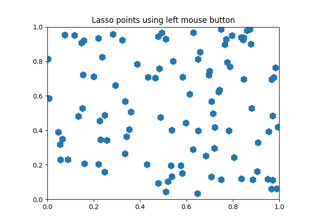
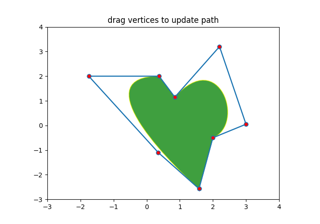
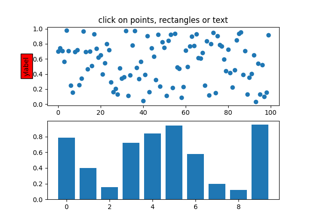
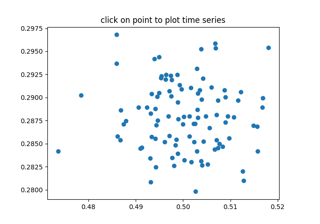
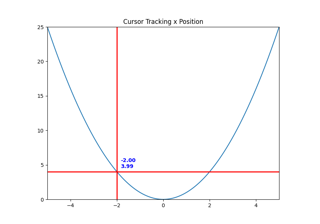
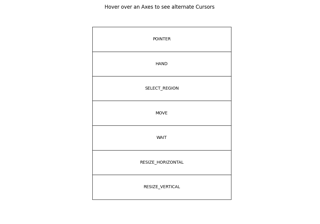
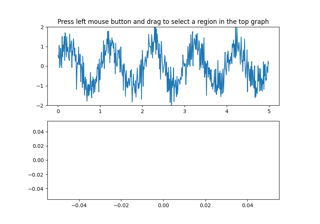
事件处理
Matplotlib 支持具有 GUI 中性事件模型的 event handling ,因此您可以连接到 Matplotlib 事件,而无需了解 Matplotlib 最终将插入到什么用户界面中.这有两个优点:您编写的代码将更具可移植性,并且 Matplotlib 事件知道诸如数据坐标空间以及事件发生在哪个轴之类的事情,因此您不必处理低级转换细节即可从画布空间转到数据空间.还包括对象拾取示例.
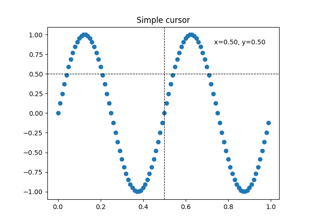
十字光标
Cross-hair cursor

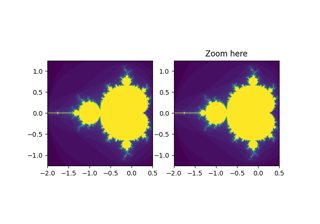
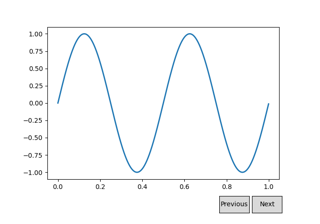
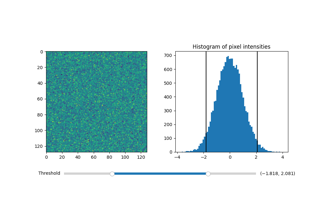
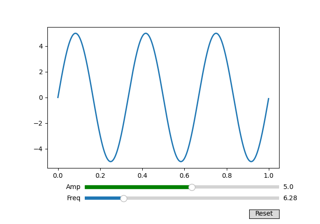
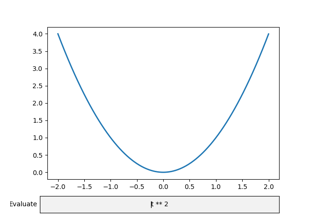
交互函数
Interactive functions

窥镜
Looking glass
其他

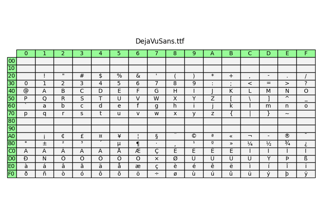
字体属性
Font properties

多进程
Multiprocessing
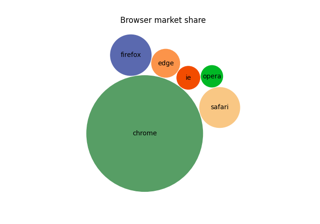
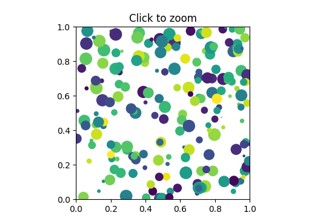
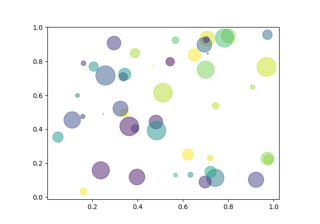
堆积气泡图
Packed-bubble chart
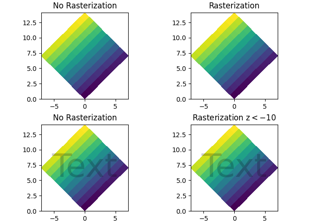
矢量图形的栅格化
Rasterization for vector graphics
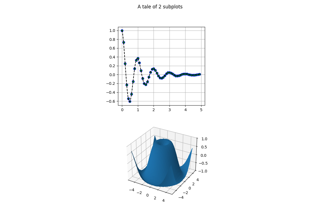
3D 绘图

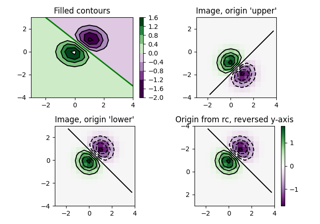
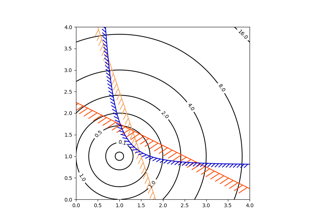
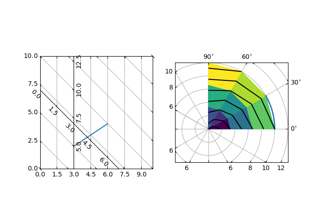
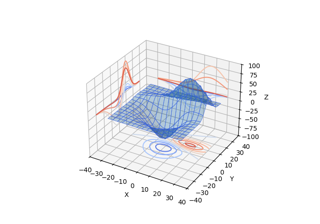
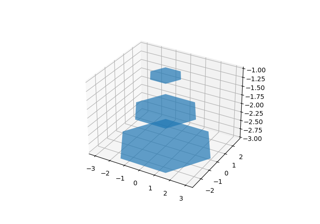
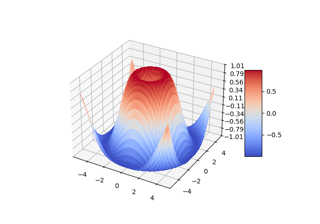
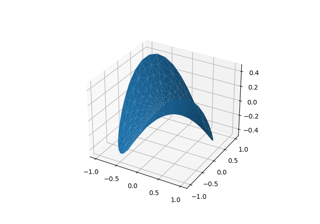
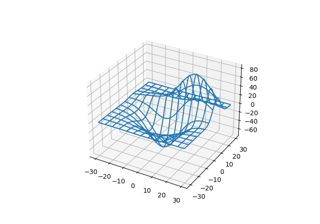
填充轮廓
Filled contours
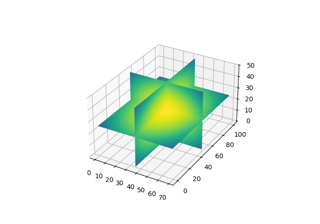
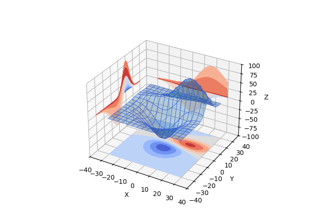
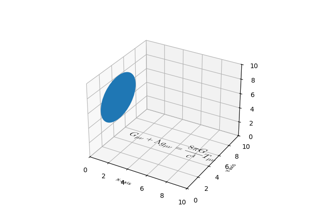
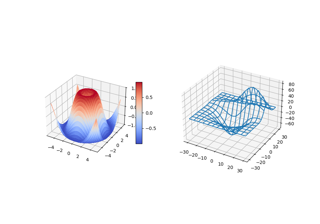
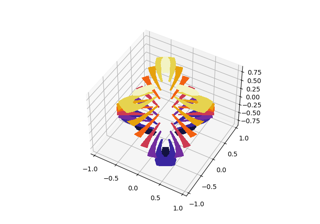
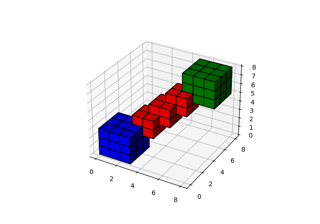
相交平面
Intersecting planes
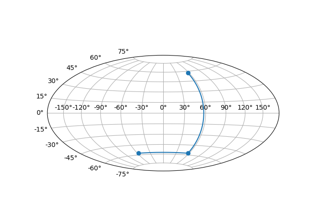
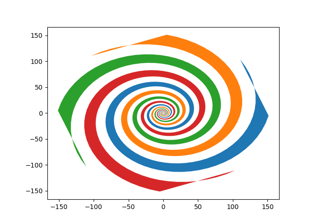
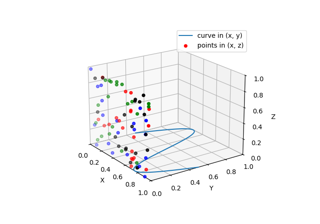
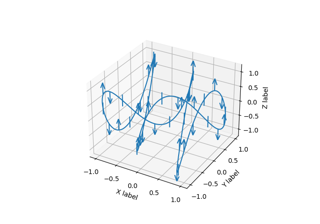
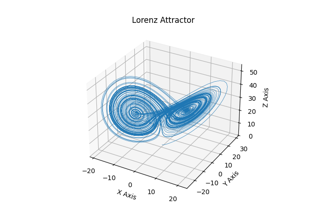
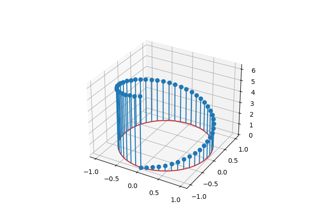
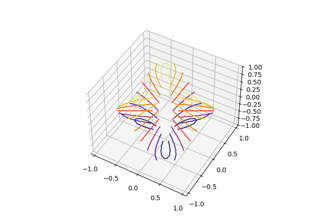
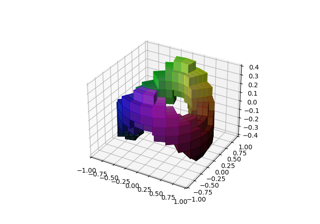
参数曲线
Parametric curve
自动文本偏移
Automatic text offsetting
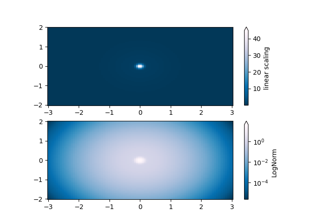
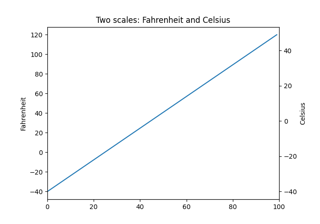
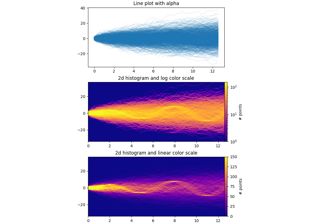
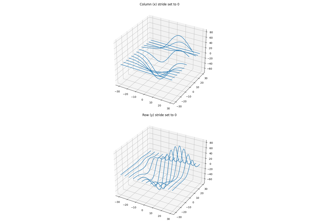
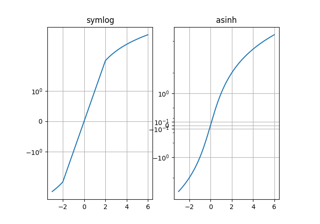
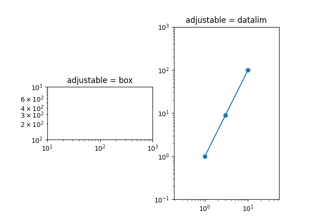
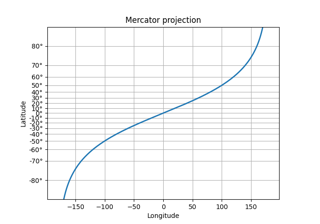
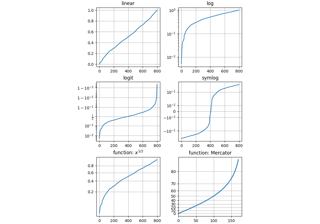
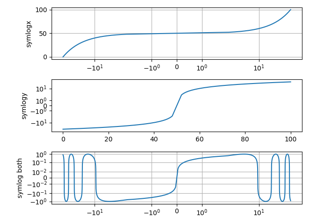
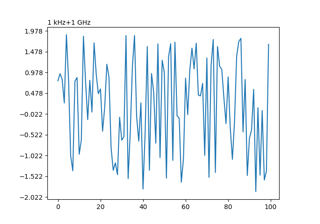
标度
这些示例涵盖了 Matplotlib 中如何处理不同的标度.
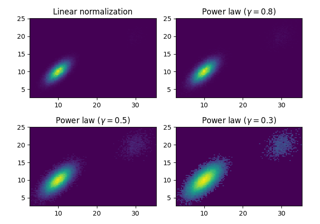
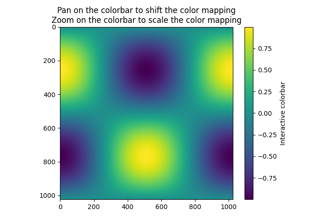
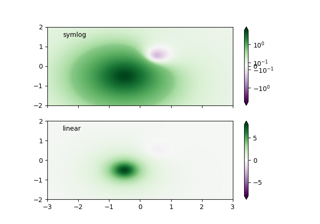
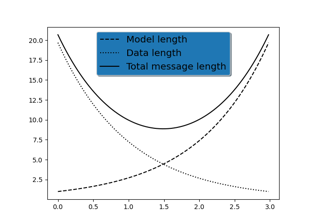
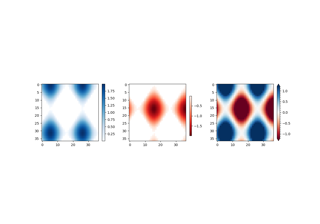
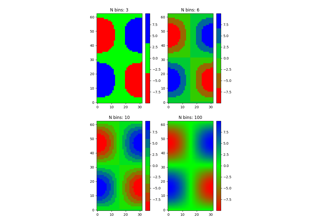
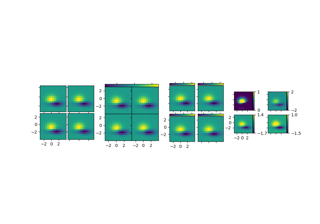
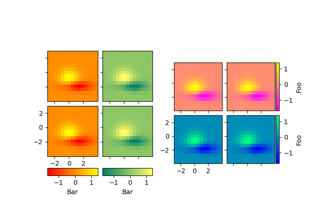
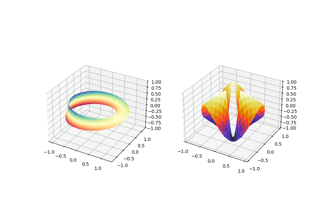
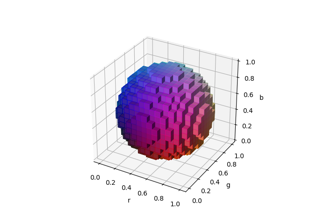
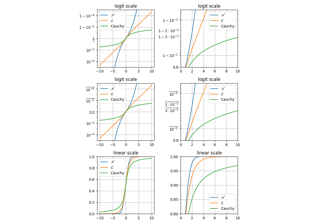
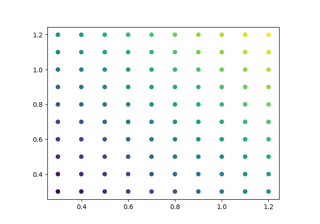
探索归一化
Exploring normalizations
特殊图表
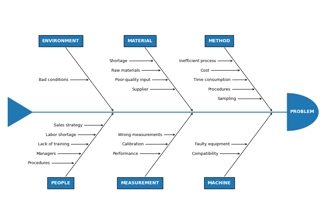
石川图
Ishikawa Diagram
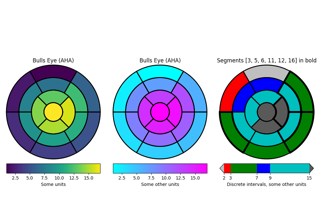
左心室牛眼图
Left ventricle bullseye
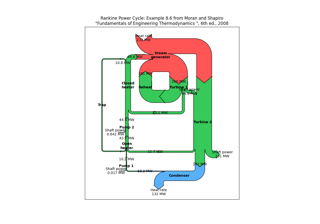
朗肯循环
Rankine power cycle
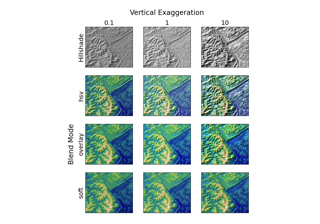
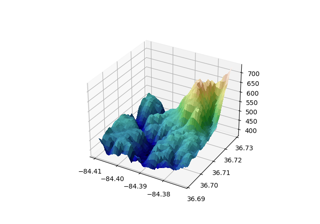
地形阴影
Topographic hillshading
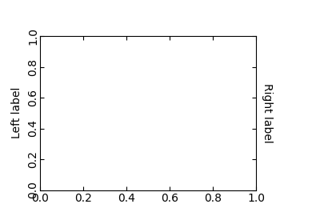
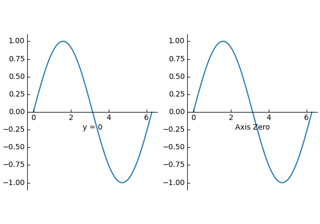
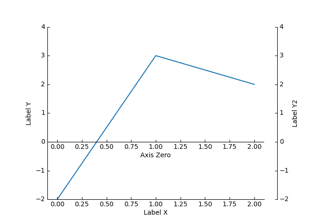
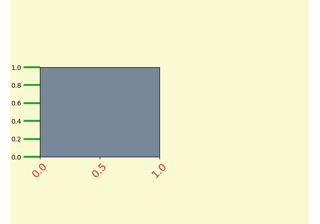
轴脊
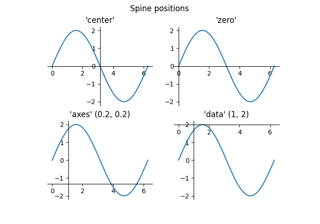
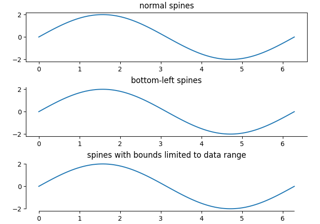
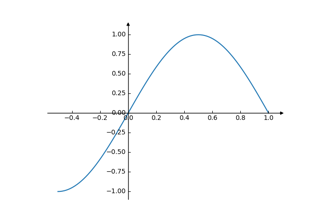
轴脊放置
Spine placement
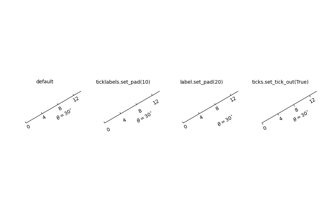
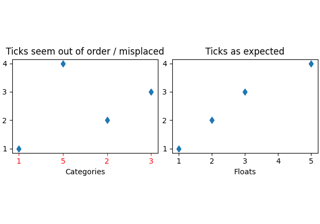
刻度
自动设置刻度位置
Automatically setting tick positions
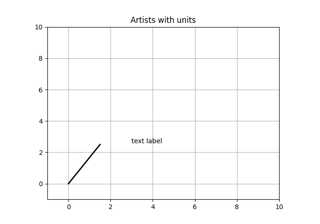
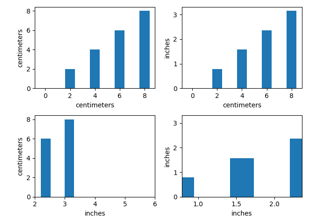
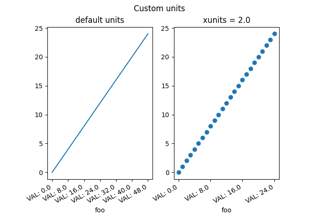
单位
这些示例涵盖了 Matplotlib 中单位的多种表示形式.
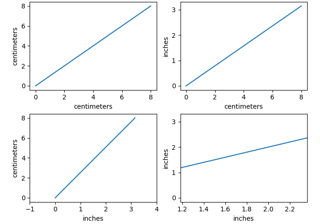
英寸和厘米
Inches and centimeters
在图形用户界面中嵌入 Matplotlib
您可以按照 embedding_in_SOMEGUI.py 示例,将 Matplotlib 直接嵌入到用户界面应用程序中.目前,Matplotlib 支持 PyQt/PySide,PyGObject,Tkinter 和 wxPython.
在 GUI 中嵌入 Matplotlib 时,您必须直接使用 Matplotlib API,而不是 pylab/pyplot 过程式接口,因此请查看 examples/api 目录,了解一些使用 API 的示例代码.