备注
Go to the end to download the full example code..
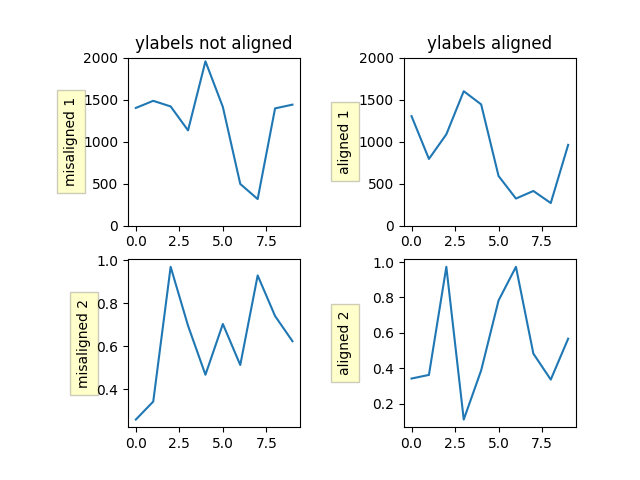
对齐 y 轴标签#
这里展示了两种方法,一种是直接调用 ` .Figure.align_ylabels `,另一种是手动对齐标签.
import matplotlib.pyplot as plt
import numpy as np


def make_plot(axs):
    box = dict(facecolor='yellow', pad=5, alpha=0.2)

    # Fixing random state for reproducibility
    np.random.seed(19680801)
    ax1 = axs[0, 0]
    ax1.plot(2000*np.random.rand(10))
    ax1.set_title('ylabels not aligned')
    ax1.set_ylabel('misaligned 1', bbox=box)
    ax1.set_ylim(0, 2000)

    ax3 = axs[1, 0]
    ax3.set_ylabel('misaligned 2', bbox=box)
    ax3.plot(np.random.rand(10))

    ax2 = axs[0, 1]
    ax2.set_title('ylabels aligned')
    ax2.plot(2000*np.random.rand(10))
    ax2.set_ylabel('aligned 1', bbox=box)
    ax2.set_ylim(0, 2000)

    ax4 = axs[1, 1]
    ax4.plot(np.random.rand(10))
    ax4.set_ylabel('aligned 2', bbox=box)


# Plot 1:
fig, axs = plt.subplots(2, 2)
fig.subplots_adjust(left=0.2, wspace=0.6)
make_plot(axs)

# just align the last column of Axes:
fig.align_ylabels(axs[:, 1])
plt.show()

参见
Figure.align_ylabels and Figure.align_labels for a direct method
of doing the same thing.
Also 对齐标签和标题
或者,我们可以使用 y 轴对象的 ` ~.Axis.set_label_coords ` 方法手动对齐子图之间的轴标签.请注意,这需要我们知道一个好的偏移值,该值是硬编码的.
fig, axs = plt.subplots(2, 2)
fig.subplots_adjust(left=0.2, wspace=0.6)

make_plot(axs)

labelx = -0.3  # axes coords

for j in range(2):
    axs[j, 1].yaxis.set_label_coords(labelx, 0.5)

plt.show()
参考
以下函数,方法,类和模块的用法在本例中显示:
` matplotlib.figure.Figure.align_ylabels `
` matplotlib.axis.Axis.set_label_coords `
matplotlib.axes.Axes.plot/matplotlib.pyplot.plotmatplotlib.axes.Axes.set_titlematplotlib.axes.Axes.set_ylabelmatplotlib.axes.Axes.set_ylim