备注
Go to the end 下载完整的示例代码.
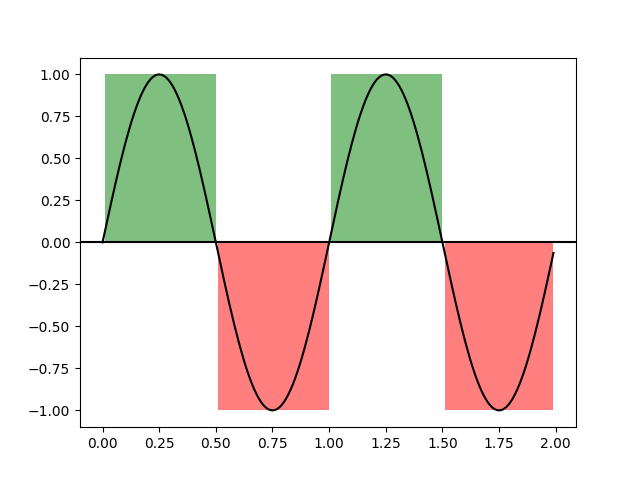
使用 fill_between 填充由逻辑掩码定义的区域#
import matplotlib.pyplot as plt
import numpy as np

t = np.arange(0.0, 2, 0.01)
s = np.sin(2*np.pi*t)

fig, ax = plt.subplots()

ax.plot(t, s, color='black')
ax.axhline(0, color='black')

ax.fill_between(t, 1, where=s > 0, facecolor='green', alpha=.5)
ax.fill_between(t, -1, where=s < 0, facecolor='red', alpha=.5)

plt.show()
参考
以下函数,方法,类和模块的用法在本例中显示:
matplotlib.axes.Axes.fill_between