备注
Go to the end 下载完整的示例代码.
修改坐标格式化器#
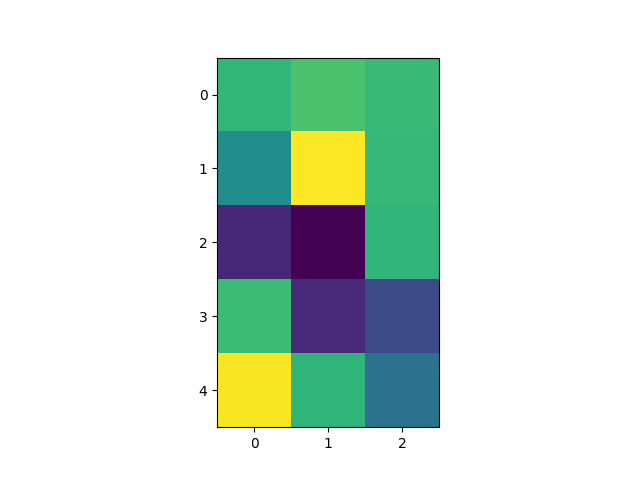
修改坐标格式化器以报告给定 x 和 y 的最近像素的图像"z"值.此功能默认内置;此示例仅展示如何自定义 format_coord 函数.
import matplotlib.pyplot as plt
import numpy as np

# Fixing random state for reproducibility
np.random.seed(19680801)


X = 10*np.random.rand(5, 3)

fig, ax = plt.subplots()
ax.imshow(X)


def format_coord(x, y):
    col = round(x)
    row = round(y)
    nrows, ncols = X.shape
    if 0 <= col < ncols and 0 <= row < nrows:
        z = X[row, col]
        return f'x={x:1.4f}, y={y:1.4f}, z={z:1.4f}'
    else:
        return f'x={x:1.4f}, y={y:1.4f}'


ax.format_coord = format_coord
plt.show()
参考
以下函数,方法,类和模块的用法在本例中显示:
matplotlib.axes.Axes.format_coordmatplotlib.axes.Axes.imshow