备注
Go to the end 下载完整的示例代码.
箱线图的单独计算和绘图#
绘制给定数据集的 boxplot 由两个主要操作组成,它们也可以单独使用:
计算箱线图统计信息:
matplotlib.cbook.boxplot_stats绘制箱线图:
matplotlib.axes.Axes.bxp
因此, ax.boxplot(data) 等效于
stats = cbook.boxplot_stats(data)
ax.bxp(stats)
所有样式关键字参数在 boxplot 和 bxp 之间都是相同的,并且它们是从 boxplot 传递到 bxp 的. 但是, boxplot 的 tick_labels 参数转换为 boxplot_stats 中的通用 labels 参数,因为标签与数据相关并附加到返回的每个数据集字典.
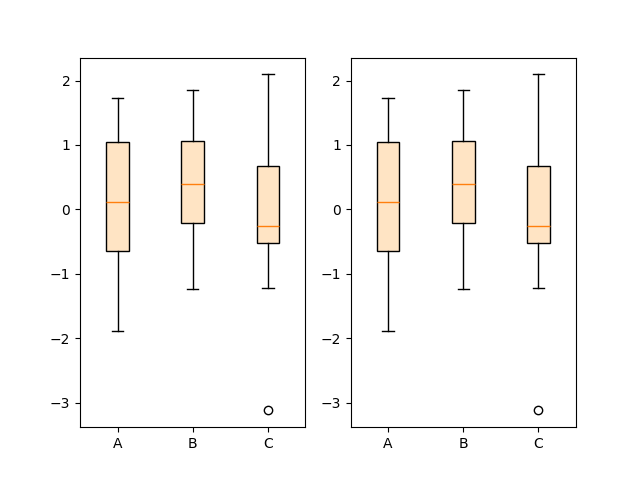
以下代码演示了这两种方法之间的等效性.
import matplotlib.pyplot as plt
import numpy as np

from matplotlib import cbook

np.random.seed(19680801)
data = np.random.randn(20, 3)

fig, (ax1, ax2) = plt.subplots(1, 2)

# single boxplot call
ax1.boxplot(data, tick_labels=['A', 'B', 'C'],
            patch_artist=True, boxprops={'facecolor': 'bisque'})

# separate calculation of statistics and plotting
stats = cbook.boxplot_stats(data, labels=['A', 'B', 'C'])
ax2.bxp(stats, patch_artist=True, boxprops={'facecolor': 'bisque'})
使用单独的函数可以预先计算统计信息,以防您需要显式地将它们用于其他目的,或者重用统计信息以进行多次绘图.
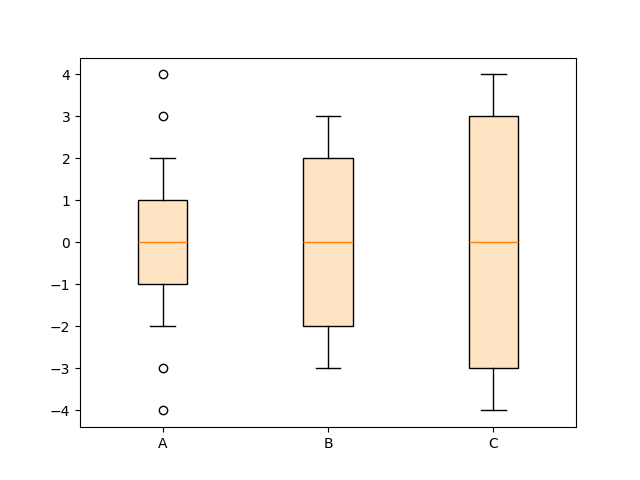
相反,如果您已经拥有统计参数,也可以直接使用 bxp 函数:
fig, ax = plt.subplots()

stats = [
    dict(med=0, q1=-1, q3=1, whislo=-2, whishi=2, fliers=[-4, -3, 3, 4], label='A'),
    dict(med=0, q1=-2, q3=2, whislo=-3, whishi=3, fliers=[], label='B'),
    dict(med=0, q1=-3, q3=3, whislo=-4, whishi=4, fliers=[], label='C'),
]

ax.bxp(stats, patch_artist=True, boxprops={'facecolor': 'bisque'})

plt.show()
参考
以下函数,方法,类和模块的用法在本例中显示:
matplotlib.axes.Axes.bxpmatplotlib.axes.Axes.boxplotmatplotlib.cbook.boxplot_stats