备注
Go to the end 下载完整的示例代码. `
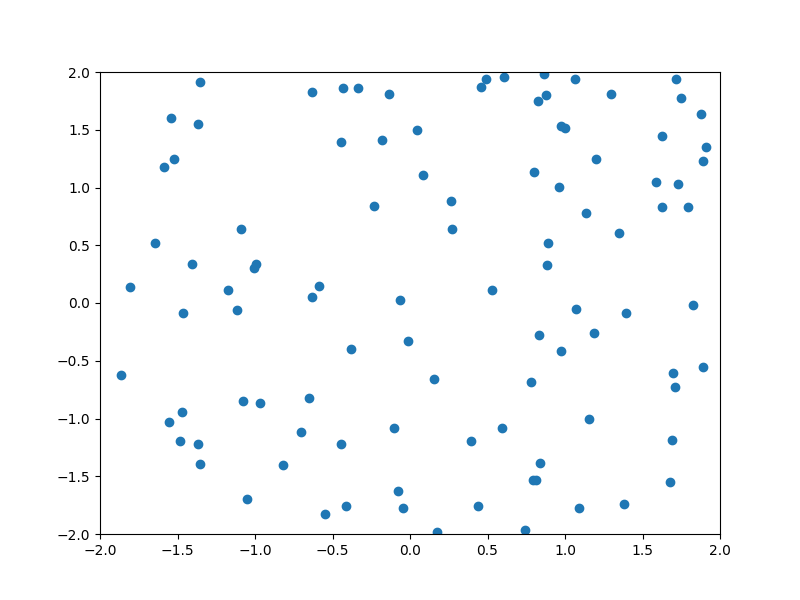
光标#
import matplotlib.pyplot as plt
import numpy as np

from matplotlib.widgets import Cursor

# Fixing random state for reproducibility
np.random.seed(19680801)

fig, ax = plt.subplots(figsize=(8, 6))

x, y = 4*(np.random.rand(2, 100) - .5)
ax.plot(x, y, 'o')
ax.set_xlim(-2, 2)
ax.set_ylim(-2, 2)

# Set useblit=True on most backends for enhanced performance.
cursor = Cursor(ax, useblit=True, color='red', linewidth=2)

plt.show()
参考
以下函数,方法,类和模块的用法在本例中显示:
` matplotlib.widgets.Cursor `