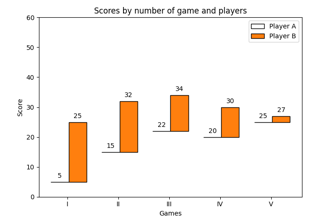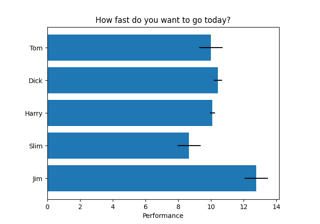
水平柱状图
Horizontal bar chart
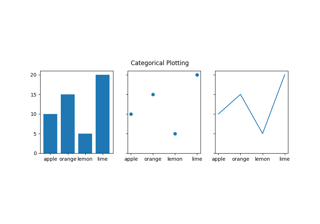
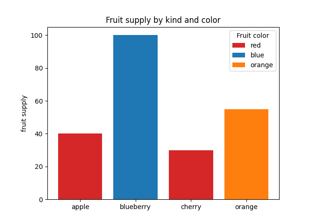
绘制分类变量
Plotting categorical variables
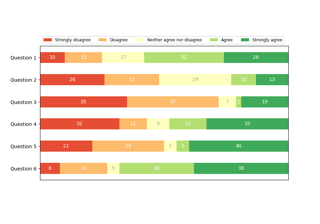
离散分布作为水平条形图
Discrete distribution as horizontal bar chart
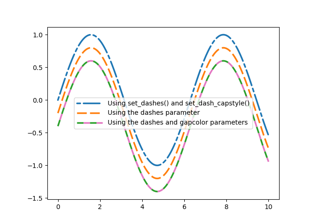
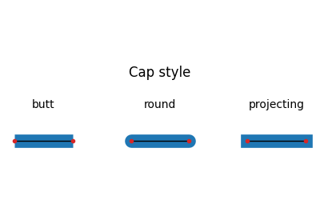
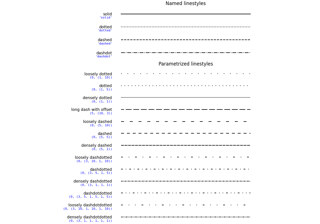
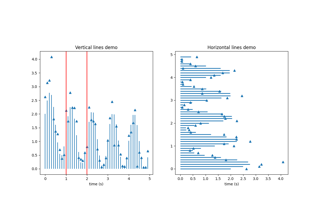
虚线样式配置
Dashed line style configuration
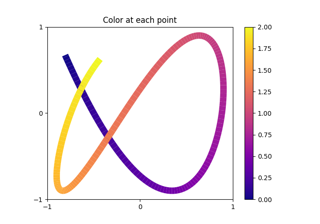
多色线条
Multicolored lines

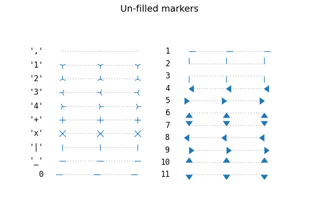
标记示例
Marker examples
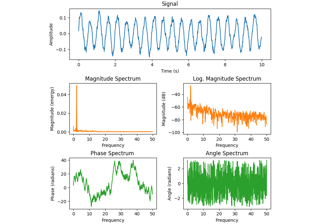
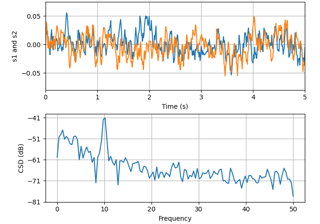
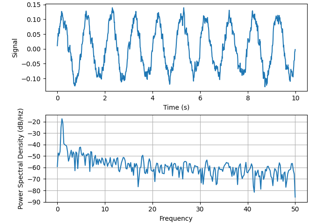
频谱表示
Spectrum representations
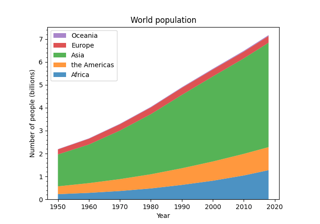
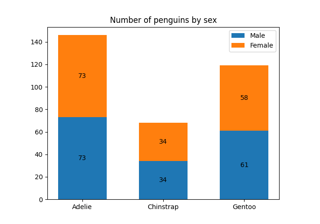
堆叠图和流图
Stackplots and streamgraphs
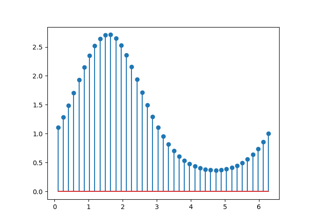
茎图
Stem plot
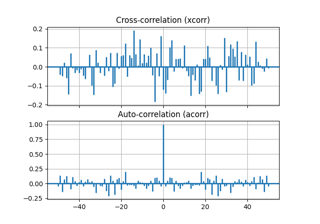
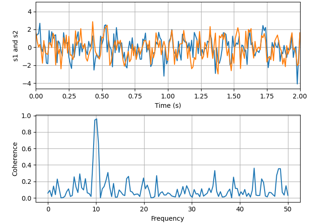
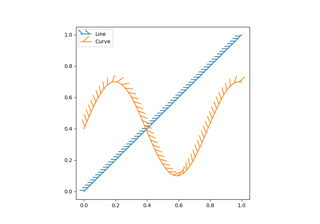
互相关和自相关
Cross- and auto-correlation