备注
Go to the end 下载完整的示例代码.
Zorder 演示#
艺术家的绘制顺序由他们的 zorder 属性决定,这是一个浮点数. zorder 较高的艺术家绘制在顶部.您可以通过设置艺术家的 zorder 来更改个别艺术家的顺序.默认值取决于艺术家的类型:
艺术家 |
Z 顺序 |
|---|---|
图像( |
0 |
|
1 |
|
2 |
主刻度 |
2.01 |
|
3 |
|
5 |
对绘图方法的任何调用都可以为该特定项目的 zorder 显式设置一个值.
备注
set_axisbelow 和 rcParams["axes.axisbelow"] (default: 'line') 是设置刻度和网格线 zorder 的便捷助手.
绘制一次按 Axes 进行.如果你有重叠的轴,第二个轴的所有元素都会绘制在第一个轴的顶部,而不管它们相对的 zorder 如何.
import matplotlib.pyplot as plt
import numpy as np

r = np.linspace(0.3, 1, 30)
theta = np.linspace(0, 4*np.pi, 30)
x = r * np.sin(theta)
y = r * np.cos(theta)
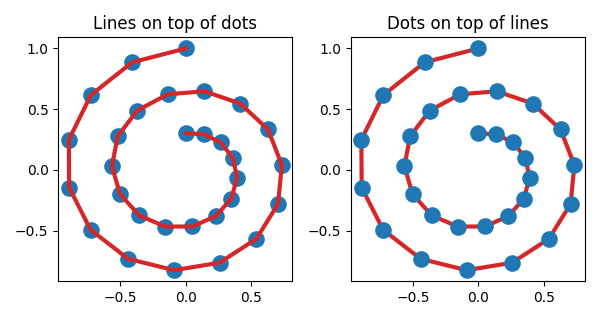
以下示例包含 plot() 创建的 Line2D 和 scatter() 创建的点( PatchCollection ).因此,默认情况下,点在线下方(第一个子图).在第二个子图中,显式设置 zorder 以将点移动到线的顶部.
fig, (ax1, ax2) = plt.subplots(1, 2, figsize=(6, 3.2))

ax1.plot(x, y, 'C3', lw=3)
ax1.scatter(x, y, s=120)
ax1.set_title('Lines on top of dots')

ax2.plot(x, y, 'C3', lw=3)
ax2.scatter(x, y, s=120, zorder=2.5)  # move dots on top of line
ax2.set_title('Dots on top of lines')

plt.tight_layout()
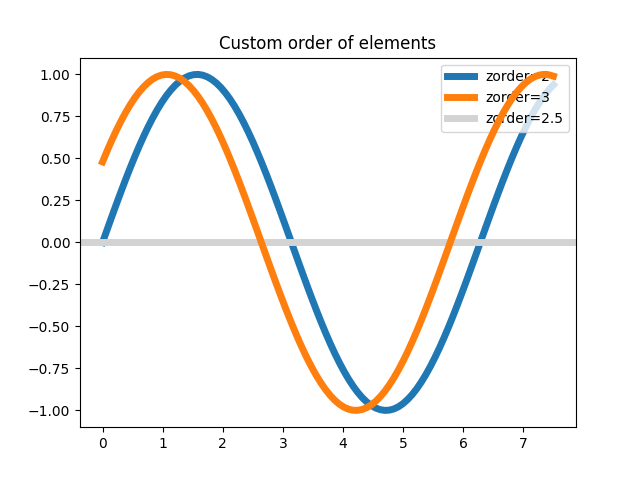
许多创建可见对象的函数都接受 zorder 参数.或者,您可以在创建对象后调用 set_zorder() .
x = np.linspace(0, 7.5, 100)
plt.rcParams['lines.linewidth'] = 5
plt.figure()
plt.plot(x, np.sin(x), label='zorder=2', zorder=2)  # bottom
plt.plot(x, np.sin(x+0.5), label='zorder=3',  zorder=3)
plt.axhline(0, label='zorder=2.5', color='lightgrey', zorder=2.5)
plt.title('Custom order of elements')
l = plt.legend(loc='upper right')
l.set_zorder(2.5)  # legend between blue and orange line
plt.show()