备注
Go to the end 下载完整的示例代码.
日期刻度标签#
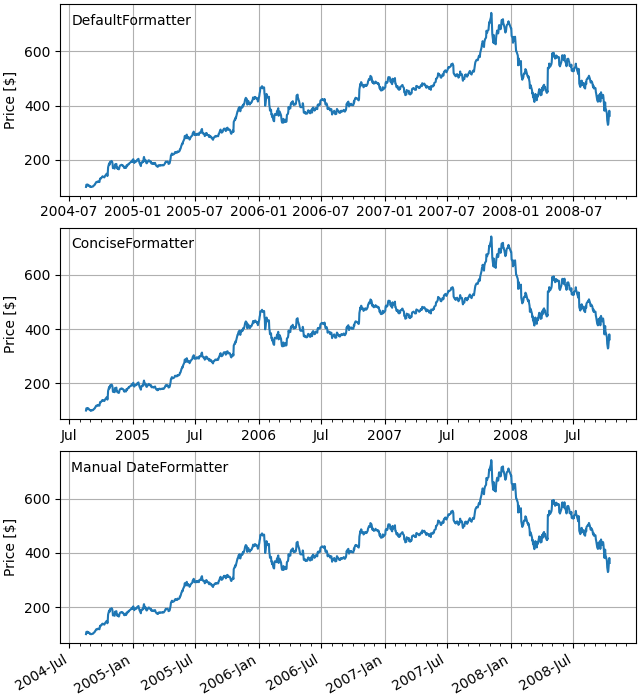
Matplotlib 日期绘图通过将日期实例转换为自 epoch 以来的天数(默认情况下为 1970-01-01T00:00:00)来完成. matplotlib.dates 模块提供了转换函数 date2num 和 num2date ,用于在 datetime.datetime 和 numpy.datetime64 对象与 Matplotlib 的内部表示之间进行转换.这些数据类型在 matplotlib.units 中描述的单位转换机制中注册,因此对于用户来说,转换会自动发生.注册过程还设置了轴的默认刻度 locator 和 formatter 为 AutoDateLocator 和 AutoDateFormatter .
另一种格式化程序是 ConciseDateFormatter ,在下面的第二个 Axes 中使用(参见 使用 ConciseDateFormatter 格式化日期刻度 ),它通常可以避免旋转刻度标签.最后一个 Axes 手动格式化日期,使用 DateFormatter 使用 datetime.date.strftime 中记录的格式字符串来格式化日期.
import matplotlib.pyplot as plt

import matplotlib.cbook as cbook
import matplotlib.dates as mdates

# Load a numpy record array from yahoo csv data with fields date, open, high,
# low, close, volume, adj_close from the mpl-data/sample_data directory. The
# record array stores the date as an np.datetime64 with a day unit ('D') in
# the date column.
data = cbook.get_sample_data('goog.npz')['price_data']

fig, axs = plt.subplots(3, 1, figsize=(6.4, 7), layout='constrained')
# common to all three:
for ax in axs:
    ax.plot('date', 'adj_close', data=data)
    # Major ticks every half year, minor ticks every month,
    ax.xaxis.set_major_locator(mdates.MonthLocator(bymonth=(1, 7)))
    ax.xaxis.set_minor_locator(mdates.MonthLocator())
    ax.grid(True)
    ax.set_ylabel(r'Price [\$]')

# different formats:
ax = axs[0]
ax.set_title('DefaultFormatter', loc='left', y=0.85, x=0.02, fontsize='medium')

ax = axs[1]
ax.set_title('ConciseFormatter', loc='left', y=0.85, x=0.02, fontsize='medium')
ax.xaxis.set_major_formatter(
    mdates.ConciseDateFormatter(ax.xaxis.get_major_locator()))

ax = axs[2]
ax.set_title('Manual DateFormatter', loc='left', y=0.85, x=0.02,
             fontsize='medium')
# Text in the x-axis will be displayed in 'YYYY-mm' format.
ax.xaxis.set_major_formatter(mdates.DateFormatter('%Y-%b'))
# Rotates and right-aligns the x labels so they don't crowd each other.
for label in ax.get_xticklabels(which='major'):
    label.set(rotation=30, horizontalalignment='right')

plt.show()
脚本的总运行时间:(0 分 1.670 秒)