备注
Go to the end 下载完整的示例代码.
使用 pyplot 的文本和 mathtext#
通过专用的 pyplot 函数设置特殊文本对象 title , xlabel 和 ylabel .可以使用 text 将其他文本对象放置在 Axes 中.
您可以在所有文本中使用类似 TeX 的数学排版;另请参见 书写数学表达式 .
import matplotlib.pyplot as plt
import numpy as np
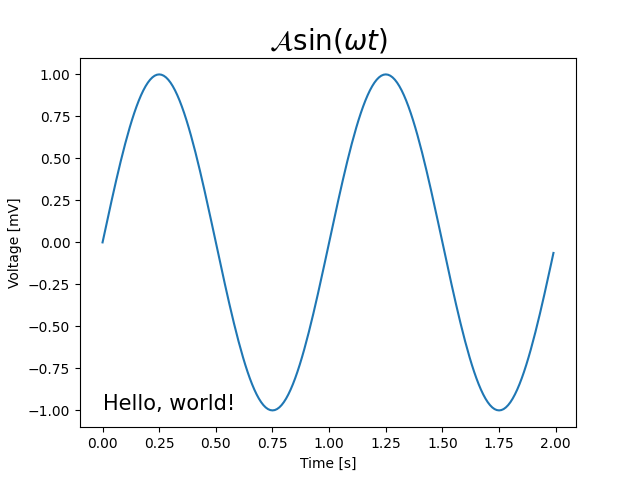
t = np.arange(0.0, 2.0, 0.01)
s = np.sin(2*np.pi*t)
plt.plot(t, s)
plt.text(0, -1, r'Hello, world!', fontsize=15)
plt.title(r'$\mathcal{A}\sin(\omega t)$', fontsize=20)
plt.xlabel('Time [s]')
plt.ylabel('Voltage [mV]')
plt.show()
参考
以下函数,方法,类和模块的用法在本例中显示:
matplotlib.pyplot.histmatplotlib.pyplot.xlabelmatplotlib.pyplot.ylabelmatplotlib.pyplot.textmatplotlib.pyplot.gridmatplotlib.pyplot.show