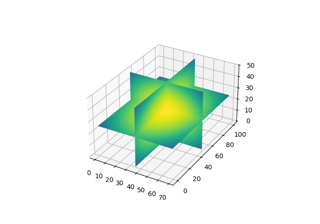
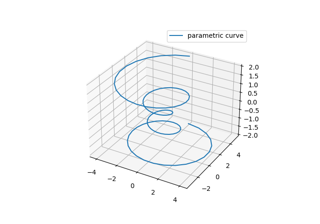
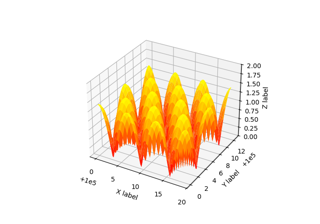
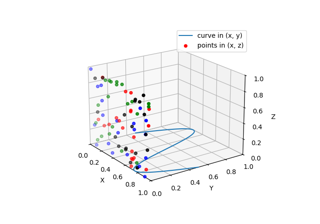
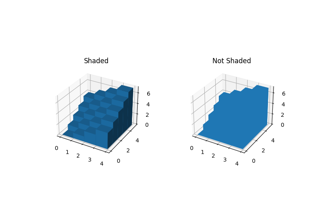
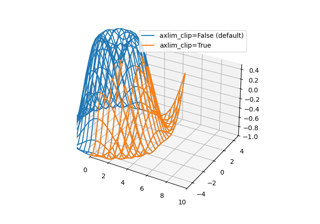
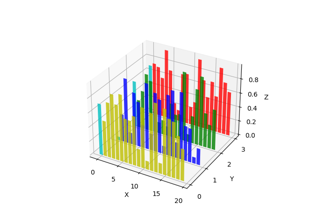
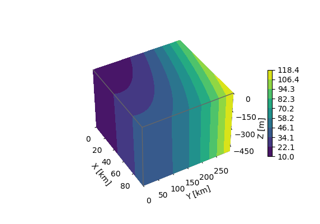
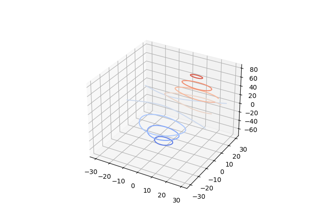
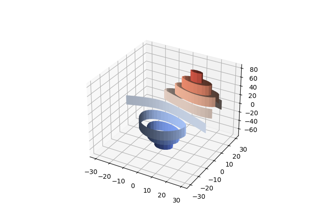
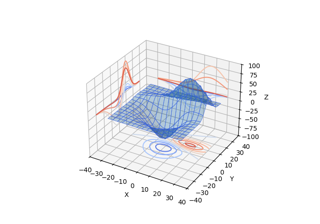
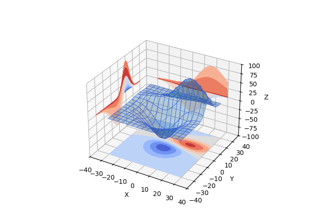
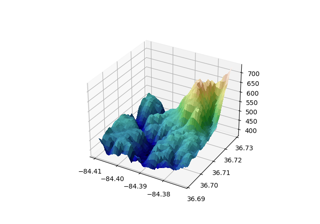
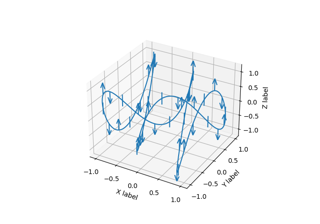
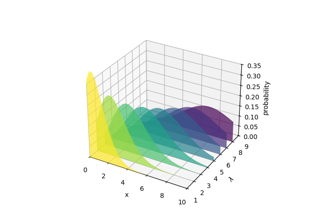
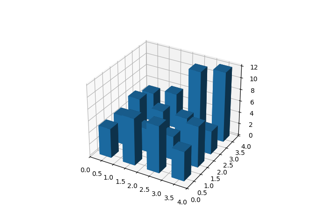
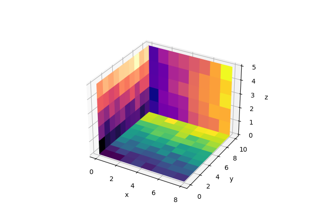
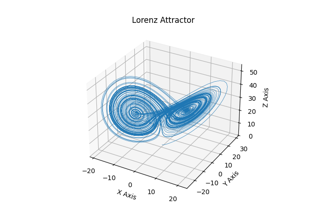
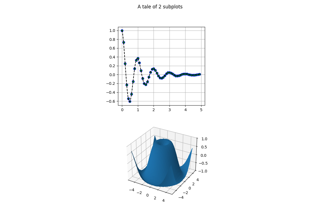
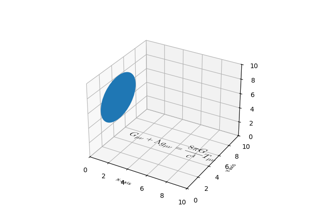
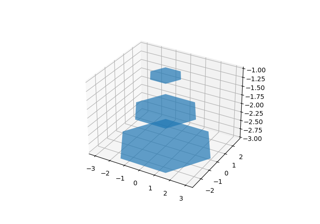
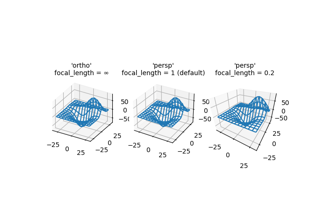
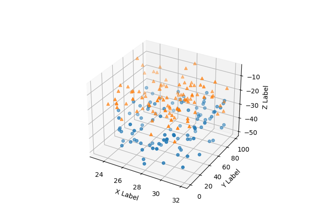
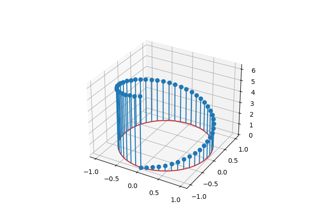
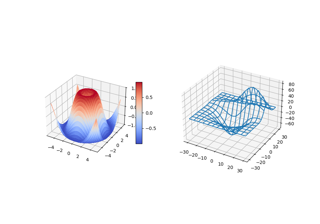
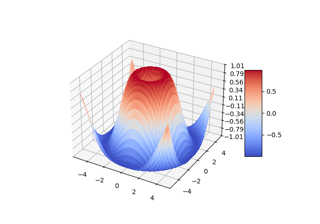
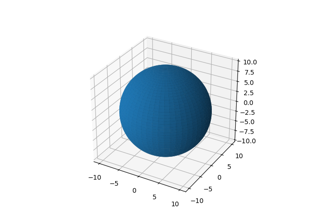
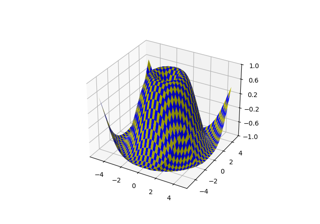
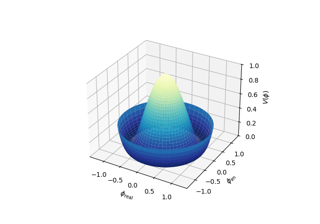
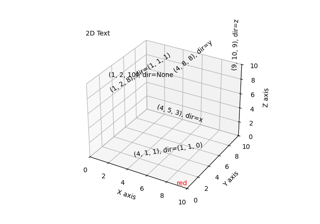
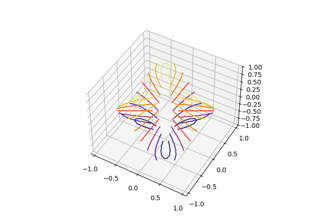
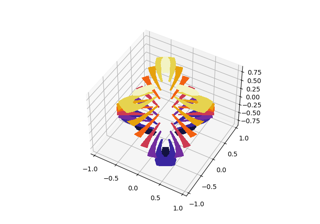
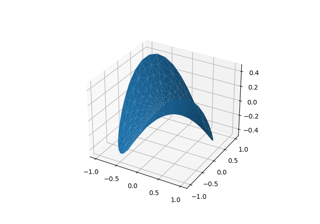
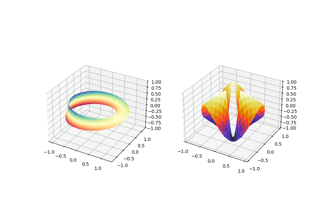
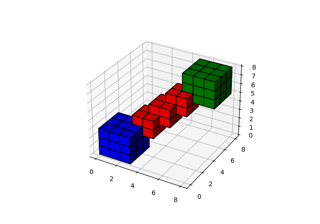
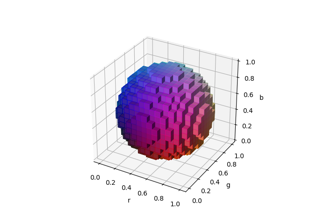
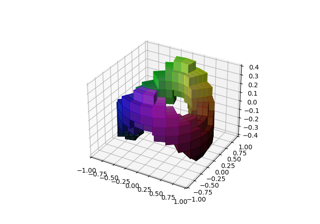
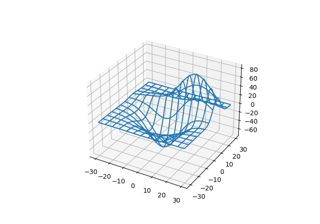
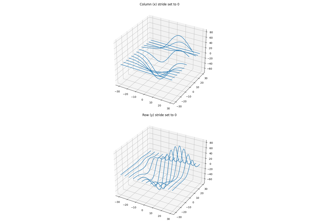
3D 绘图# 在 3D 图上绘制 2D 数据 Plot 2D data on 3D plot 3D 条形图演示 Demo of 3D bar charts 将数据裁剪到坐标轴视图限制 Clip the data to the axes view limits 在不同的平面上创建 2D 条形图 Create 2D bar graphs in different planes 3D 盒状表面图 3D box surface plot 绘制 3D 轮廓(水平)曲线 Plot contour (level) curves in 3D 使用 extend3d 选项绘制 3D 轮廓(水平)曲线 Plot contour (level) curves in 3D using the extend3d option 将轮廓剖面投影到图上 Project contour profiles onto a graph 填充轮廓 Filled contours 将填充轮廓投影到图表上 Project filled contour onto a graph 3D 曲面绘图中的自定义 hillshading Custom hillshading in a 3D surface plot 3D 误差线 3D errorbars 填充 3D 线之间的区域 Fill between 3D lines 填充 3D 折线图下方区域 Fill under 3D line graphs 创建 2D 数据的 3D 直方图 Create 3D histogram of 2D data 3D 中的 2D 图像 2D images in 3D 相交平面 Intersecting planes 参数曲线 Parametric curve 洛伦兹吸引子 Lorenz attractor 同一图中具有 2D 和 3D 轴 2D and 3D Axes in same figure 自动文本偏移 Automatic text offsetting 在3D图中绘制平面对象 Draw flat objects in 3D plot 生成3D多边形 Generate 3D polygons 3D图投影类型 3D plot projection types 3D 箭袋图 3D quiver plot 旋转 3D 图 Rotating a 3D plot 3D 散点图 3D scatterplot 3D 茎图 3D stem 作为子图的 3D 图形 3D plots as subplots 3D 表面(颜色图) 3D surface (colormap) 3D 表面(纯色) 3D surface (solid color) 3D 表面(棋盘格) 3D surface (checkerboard) 具有极坐标的 3D 表面 3D surface with polar coordinates 3D 中的文本注释 Text annotations in 3D 三角 3D 等高线图 Triangular 3D contour plot 三角形 3D 填充轮廓图 Triangular 3D filled contour plot 三角形 3D 曲面 Triangular 3D surfaces 更多三角形 3D 曲面 More triangular 3D surfaces 主 3D 视图平面 Primary 3D view planes 3D 体素/体积图 3D voxel / volumetric plot NumPy 标志的 3D 体素图 3D voxel plot of the NumPy logo 具有 RGB 颜色的 3D 体素/体积图 3D voxel / volumetric plot with RGB colors 具有柱坐标的 3D 体素/体积图 3D voxel / volumetric plot with cylindrical coordinates 3D 线框图 3D wireframe plot 动画 3D 线框图 Animate a 3D wireframe plot 一个方向上的 3D 线框图 3D wireframe plots in one direction