备注
Go to the end 下载完整的示例代码.
Contourf 填充图案#
演示带有阴影图案的填充等高线图.
import matplotlib.pyplot as plt
import numpy as np

# invent some numbers, turning the x and y arrays into simple
# 2d arrays, which make combining them together easier.
x = np.linspace(-3, 5, 150).reshape(1, -1)
y = np.linspace(-3, 5, 120).reshape(-1, 1)
z = np.cos(x) + np.sin(y)

# we no longer need x and y to be 2 dimensional, so flatten them.
x, y = x.flatten(), y.flatten()
图 1:带有颜色栏的最简单的阴影图
fig1, ax1 = plt.subplots()
cs = ax1.contourf(x, y, z, hatches=['-', '/', '\\', '//'],
                  cmap='gray', extend='both', alpha=0.5)
fig1.colorbar(cs)
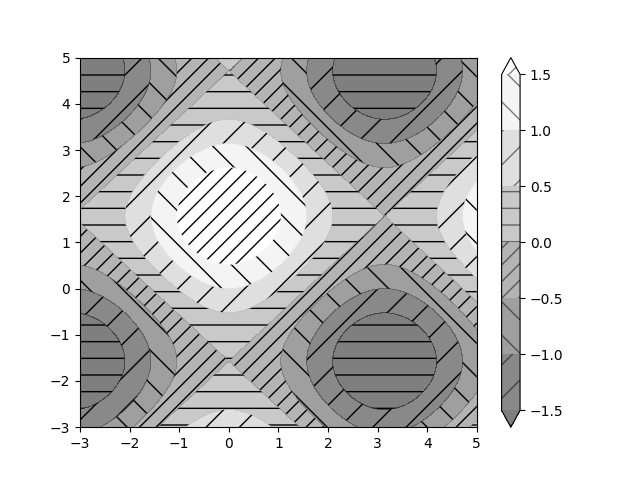
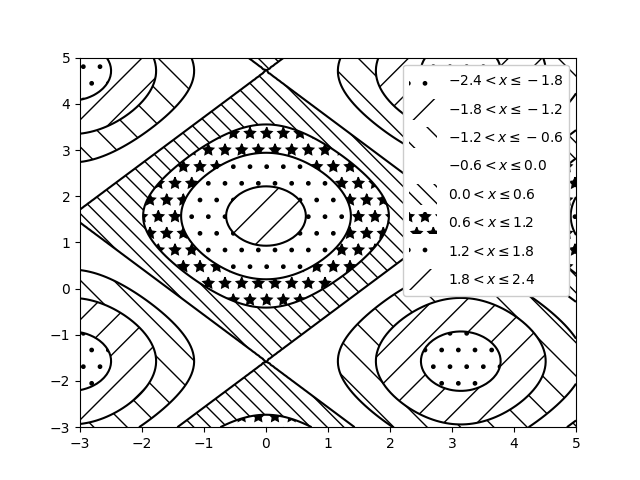
图 2:没有颜色且带有图例的阴影图
fig2, ax2 = plt.subplots()
n_levels = 6
ax2.contour(x, y, z, n_levels, colors='black', linestyles='-')
cs = ax2.contourf(x, y, z, n_levels, colors='none',
                  hatches=['.', '/', '\\', None, '\\\\', '*'],
                  extend='lower')

# create a legend for the contour set
artists, labels = cs.legend_elements(str_format='{:2.1f}'.format)
ax2.legend(artists, labels, handleheight=2, framealpha=1)
plt.show()
参考
以下函数,方法,类和模块的用法在本例中显示:
matplotlib.axes.Axes.contour/matplotlib.pyplot.contourmatplotlib.axes.Axes.contourf/matplotlib.pyplot.contourfmatplotlib.figure.Figure.colorbar/matplotlib.pyplot.colorbarmatplotlib.axes.Axes.legend/matplotlib.pyplot.legendmatplotlib.contour.ContourSetmatplotlib.contour.ContourSet.legend_elements