备注
Go to the end 下载完整的示例代码.
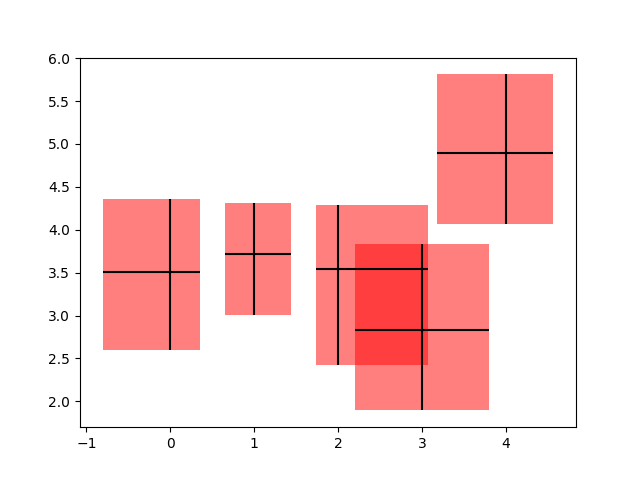
使用 PatchCollection 从误差线创建框#
在此示例中,我们通过添加一个矩形补丁来修饰一个非常标准的误差线图,该补丁由 x 和 y 方向上的条形图限制定义. 为此,我们必须编写我们自己的自定义函数,称为 make_error_boxes . 仔细检查此函数将揭示编写 matplotlib 函数的首选模式:
一个
Axes对象直接传递给函数该函数直接对
Axes方法进行操作,而不是通过pyplot接口可能缩写的绘图关键字参数会被拼写出来,以便将来更好地阅读代码(例如,我们使用 facecolor 而不是 fc)
Axes绘图方法返回的 artists 然后由函数返回,以便如果需要,它们的样式可以在函数外部稍后修改(在此示例中未修改).
import matplotlib.pyplot as plt
import numpy as np

from matplotlib.collections import PatchCollection
from matplotlib.patches import Rectangle

# Number of data points
n = 5

# Dummy data
np.random.seed(19680801)
x = np.arange(0, n, 1)
y = np.random.rand(n) * 5.

# Dummy errors (above and below)
xerr = np.random.rand(2, n) + 0.1
yerr = np.random.rand(2, n) + 0.2


def make_error_boxes(ax, xdata, ydata, xerror, yerror, facecolor='r',
                     edgecolor='none', alpha=0.5):

    # Loop over data points; create box from errors at each point
    errorboxes = [Rectangle((x - xe[0], y - ye[0]), xe.sum(), ye.sum())
                  for x, y, xe, ye in zip(xdata, ydata, xerror.T, yerror.T)]

    # Create patch collection with specified colour/alpha
    pc = PatchCollection(errorboxes, facecolor=facecolor, alpha=alpha,
                         edgecolor=edgecolor)

    # Add collection to Axes
    ax.add_collection(pc)

    # Plot errorbars
    artists = ax.errorbar(xdata, ydata, xerr=xerror, yerr=yerror,
                          fmt='none', ecolor='k')

    return artists


# Create figure and Axes
fig, ax = plt.subplots(1)

# Call function to create error boxes
_ = make_error_boxes(ax, x, y, xerr, yerr)

plt.show()
参考
以下函数,方法,类和模块的用法在本例中显示:
matplotlib.axes.Axes.errorbar/matplotlib.pyplot.errorbarmatplotlib.axes.Axes.add_collectionmatplotlib.collections.PatchCollection