绘图类型#

Matplotlib 提供的许多常用绘图命令概述.

有关更多示例,请参见 gallery ;有关较长示例,请参见 tutorials page .
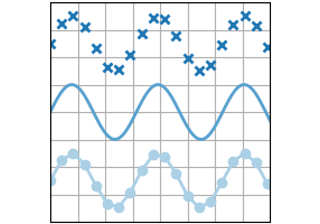
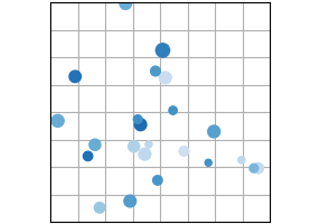
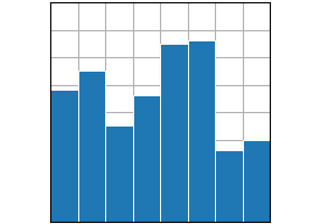
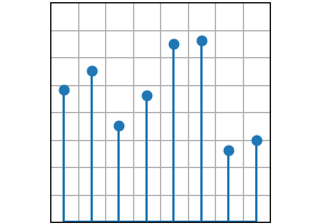
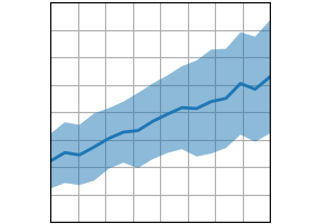
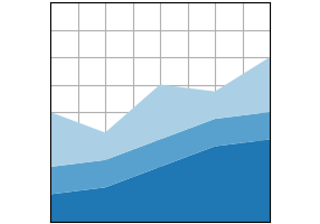
成对数据#

成对 \((x, y)\) ,表格 \((var\_0, \cdots, var\_n)\) 和函数式 \(f(x)=y\) 数据的图表.
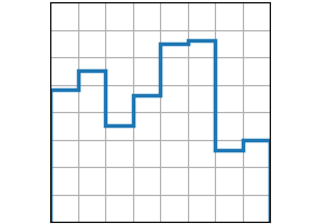
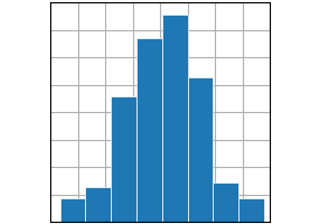
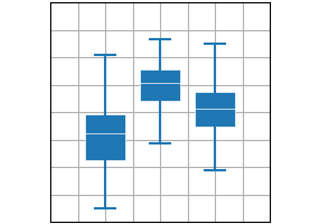
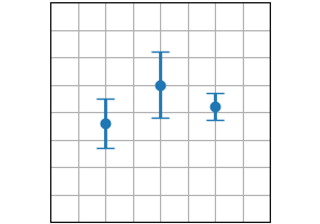
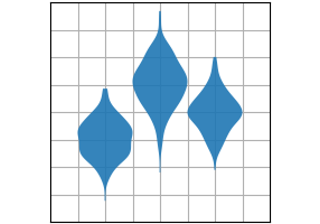
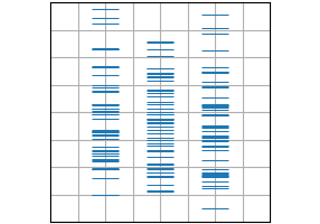
plot(x, y)

plot(x, y)

scatter(x, y)

scatter(x, y)

bar(x, height)

bar(x, height)

stem(x, y)

stem(x, y)

fill_between(x, y1, y2)

fill_between(x, y1, y2)

stackplot(x, y)

stackplot(x, y)

stairs(values)

stairs(values)

统计分布#

数据集中至少一个变量的分布图.其中一些方法还会计算分布.
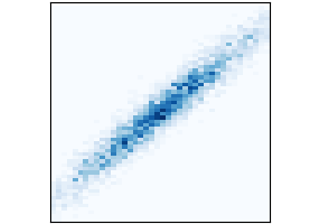
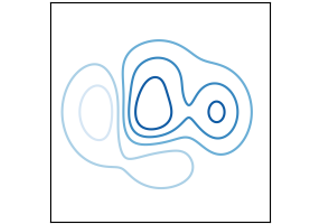
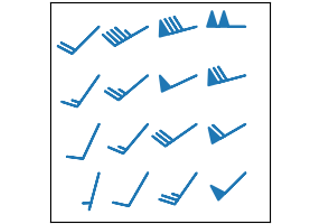
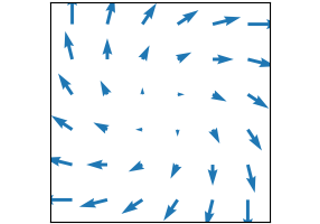
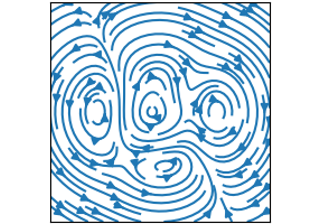
hist(x)

hist(x)

boxplot(X)

boxplot(X)

errorbar(x, y, yerr, xerr)

errorbar(x, y, yerr, xerr)

violinplot(D)

violinplot(D)

eventplot(D)

eventplot(D)

hist2d(x, y)

hist2d(x, y)

hexbin(x, y, C)

hexbin(x, y, C)

pie(x)

pie(x)

ecdf(x)

ecdf(x)

网格化数据#

\(Z_{i, j}\) 和相应的坐标网格 \(U_{i, j}, V_{i, j}\) 上,绘制数组和图像 regular grids 以及场 \(X_{i,j}, Y_{i,j}\) .
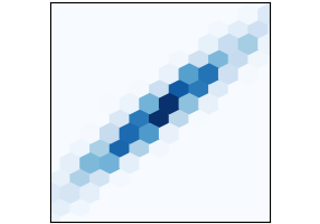
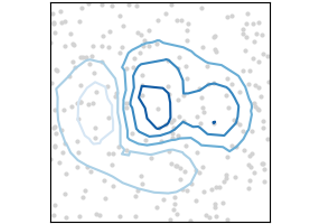
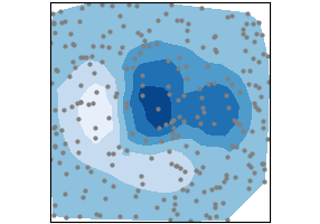
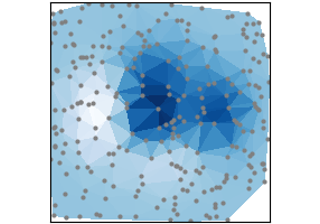
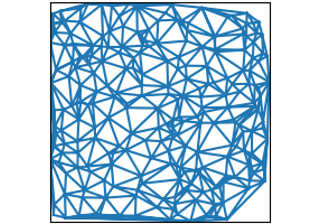
imshow(Z)

imshow(Z)

pcolormesh(X, Y, Z)

pcolormesh(X, Y, Z)

contour(X, Y, Z)

contour(X, Y, Z)

contourf(X, Y, Z)

contourf(X, Y, Z)

barbs(X, Y, U, V)

barbs(X, Y, U, V)

quiver(X, Y, U, V)

quiver(X, Y, U, V)

streamplot(X, Y, U, V)

streamplot(X, Y, U, V)

不规则网格数据#

数据 \(Z_{x, y}\)unstructured grids ,非结构化坐标网格 \((x, y)\) 和二维函数 \(f(x, y) = z\) 上的绘图.
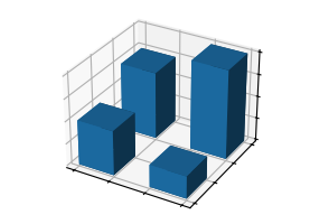
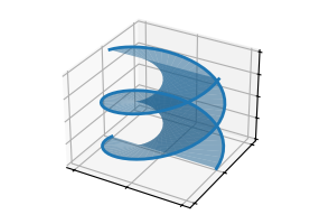
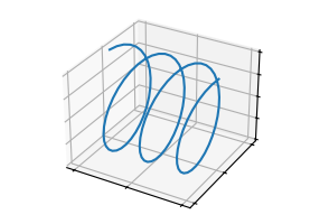
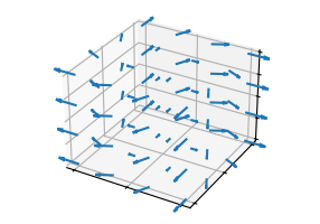
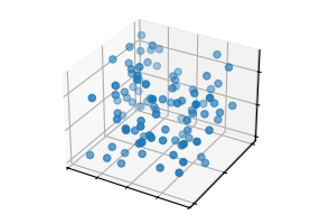
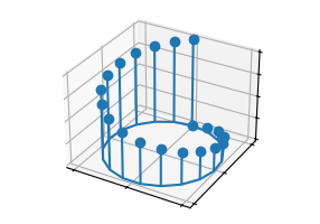
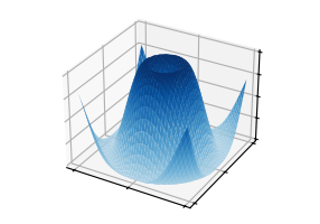
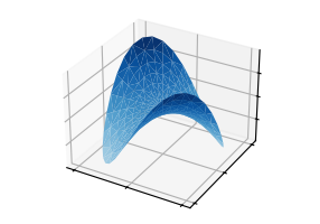
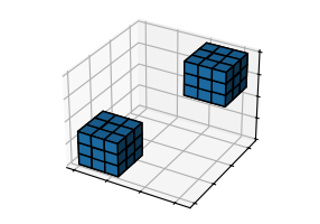
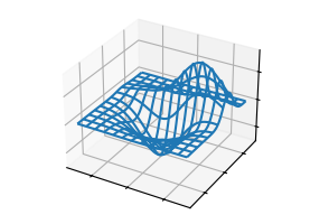
tricontour(x, y, z)

tricontour(x, y, z)

tricontourf(x, y, z)

tricontourf(x, y, z)

tripcolor(x, y, z)

tripcolor(x, y, z)

triplot(x, y)

triplot(x, y)

3D 和体积数据#

使用 mpl_toolkits.mplot3d 库绘制三维 \((x,y,z)\) ,表面 \(f(x,y)=z\) 和体积 \(V_{x, y, z}\) 数据.

bar3d(x, y, z, dx, dy, dz)

bar3d(x, y, z, dx, dy, dz)

fill_between(x1, y1, z1, x2, y2, z2)

fill_between(x1, y1, z1, x2, y2, z2)

plot(xs, ys, zs)

plot(xs, ys, zs)

quiver(X, Y, Z, U, V, W)

quiver(X, Y, Z, U, V, W)

scatter(xs, ys, zs)

scatter(xs, ys, zs)

stem(x, y, z)

stem(x, y, z)

plot_surface(X, Y, Z)

plot_surface(X, Y, Z)

plot_trisurf(x, y, z)

plot_trisurf(x, y, z)

voxels([x, y, z], filled)

voxels([x, y, z], filled)

plot_wireframe(X, Y, Z)

plot_wireframe(X, Y, Z)

Gallery generated by Sphinx-Gallery