备注
Go to the end 下载完整示例代码.
带有 AxesDivider 的颜色条#
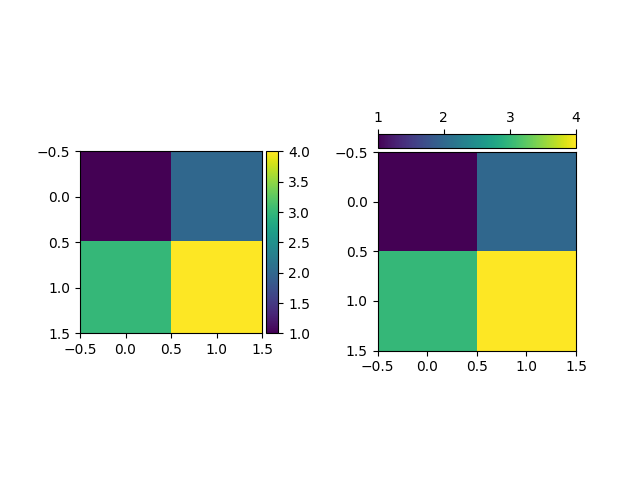
make_axes_locatable 函数接受一个现有的 Axes,将其添加到新的 AxesDivider 并返回 AxesDivider .然后可以使用 AxesDivider 的 append_axes 方法在原始 Axes 的给定侧("top","right","bottom"或"left")创建一个新的 Axes.此示例使用 append_axes 在 Axes 旁边添加颜色条.
用户应考虑简单地将主 Axes 传递给 colorbar 的 ax 关键字参数,而不是像这样手动创建可定位的 Axes.请参阅 放置颜色条 .
import matplotlib.pyplot as plt

from mpl_toolkits.axes_grid1.axes_divider import make_axes_locatable

fig, (ax1, ax2) = plt.subplots(1, 2)
fig.subplots_adjust(wspace=0.5)

im1 = ax1.imshow([[1, 2], [3, 4]])
ax1_divider = make_axes_locatable(ax1)
# Add an Axes to the right of the main Axes.
cax1 = ax1_divider.append_axes("right", size="7%", pad="2%")
cb1 = fig.colorbar(im1, cax=cax1)

im2 = ax2.imshow([[1, 2], [3, 4]])
ax2_divider = make_axes_locatable(ax2)
# Add an Axes above the main Axes.
cax2 = ax2_divider.append_axes("top", size="7%", pad="2%")
cb2 = fig.colorbar(im2, cax=cax2, orientation="horizontal")
# Change tick position to top (with the default tick position "bottom", ticks
# overlap the image).
cax2.xaxis.set_ticks_position("top")

plt.show()