备注
Go to the end 下载完整示例代码.
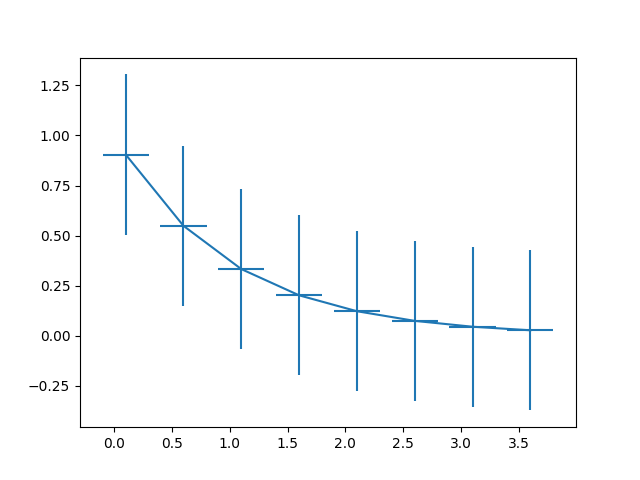
误差线函数#
这展示了误差线方法最基本的用法. 在这种情况下,为 x 和 y 方向的误差提供了常数值.
import matplotlib.pyplot as plt
import numpy as np

# example data
x = np.arange(0.1, 4, 0.5)
y = np.exp(-x)

fig, ax = plt.subplots()
ax.errorbar(x, y, xerr=0.2, yerr=0.4)
plt.show()
参考
以下函数,方法,类和模块的用法在本例中显示:
matplotlib.axes.Axes.errorbar/matplotlib.pyplot.errorbar