备注
Go to the end 下载完整的示例代码.
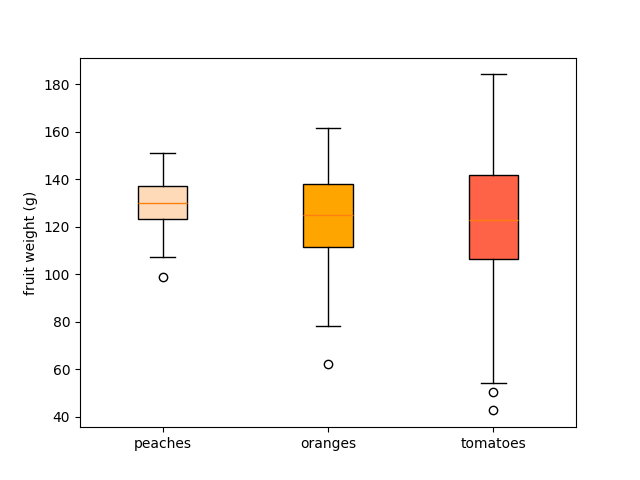
具有自定义填充颜色的箱线图#
为了单独着色箱线图的每个框:
使用关键字参数
patch_artist=True创建填充框.循环遍历创建的框,并调整它们的颜色.
import matplotlib.pyplot as plt
import numpy as np

np.random.seed(19680801)
fruit_weights = [
    np.random.normal(130, 10, size=100),
    np.random.normal(125, 20, size=100),
    np.random.normal(120, 30, size=100),
]
labels = ['peaches', 'oranges', 'tomatoes']
colors = ['peachpuff', 'orange', 'tomato']

fig, ax = plt.subplots()
ax.set_ylabel('fruit weight (g)')

bplot = ax.boxplot(fruit_weights,
                   patch_artist=True,  # fill with color
                   tick_labels=labels)  # will be used to label x-ticks

# fill with colors
for patch, color in zip(bplot['boxes'], colors):
    patch.set_facecolor(color)

plt.show()
参考
以下函数,方法,类和模块的用法在本例中显示:
matplotlib.axes.Axes.boxplot/matplotlib.pyplot.boxplot