备注
Go to the end 下载完整的示例代码.
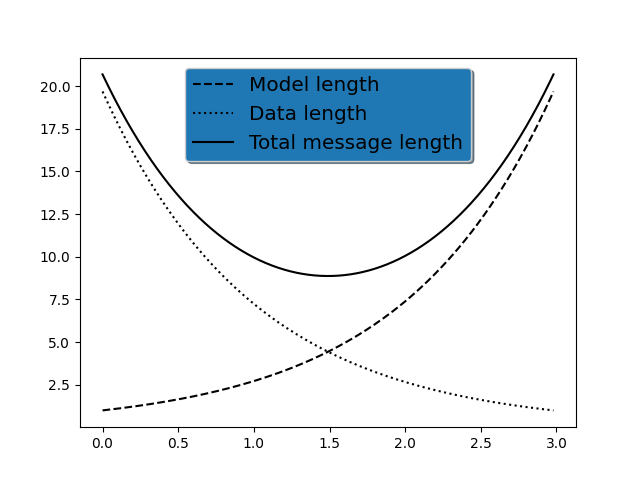
使用预定义标签的图例#
使用绘图定义图例标签.
import matplotlib.pyplot as plt
import numpy as np

# Make some fake data.
a = b = np.arange(0, 3, .02)
c = np.exp(a)
d = c[::-1]

# Create plots with pre-defined labels.
fig, ax = plt.subplots()
ax.plot(a, c, 'k--', label='Model length')
ax.plot(a, d, 'k:', label='Data length')
ax.plot(a, c + d, 'k', label='Total message length')

legend = ax.legend(loc='upper center', shadow=True, fontsize='x-large')

# Put a nicer background color on the legend.
legend.get_frame().set_facecolor('C0')

plt.show()
参考
以下函数,方法,类和模块的用法在本例中显示:
matplotlib.axes.Axes.plot/matplotlib.pyplot.plotmatplotlib.axes.Axes.legend/matplotlib.pyplot.legend