备注
Go to the end 以下载完整示例代码.
等高线标签示例#
演示一些可以使用等高线标签完成的更高级的功能.
另请参阅 contour demo example .
import matplotlib.pyplot as plt
import numpy as np

import matplotlib.ticker as ticker
定义我们的曲面
delta = 0.025
x = np.arange(-3.0, 3.0, delta)
y = np.arange(-2.0, 2.0, delta)
X, Y = np.meshgrid(x, y)
Z1 = np.exp(-X**2 - Y**2)
Z2 = np.exp(-(X - 1)**2 - (Y - 1)**2)
Z = (Z1 - Z2) * 2
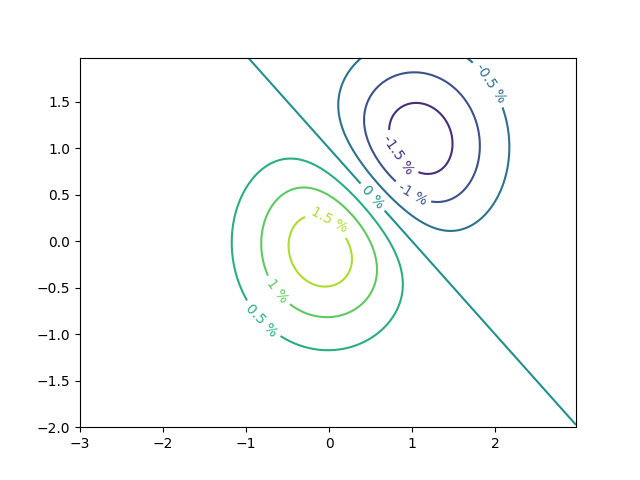
使用自定义级别格式化器创建等高线标签
# This custom formatter removes trailing zeros, e.g. "1.0" becomes "1", and
# then adds a percent sign.
def fmt(x):
    s = f"{x:.1f}"
    if s.endswith("0"):
        s = f"{x:.0f}"
    return rf"{s} \%" if plt.rcParams["text.usetex"] else f"{s} %"


# Basic contour plot
fig, ax = plt.subplots()
CS = ax.contour(X, Y, Z)

ax.clabel(CS, CS.levels, fmt=fmt, fontsize=10)
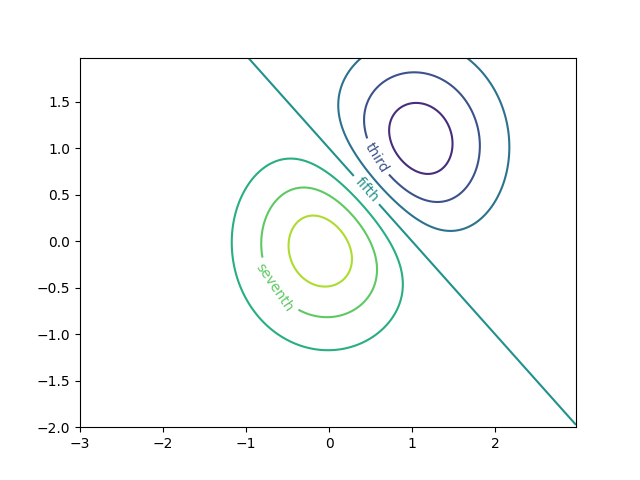
使用字典,用任意字符串标记等高线
fig1, ax1 = plt.subplots()

# Basic contour plot
CS1 = ax1.contour(X, Y, Z)

fmt = {}
strs = ['first', 'second', 'third', 'fourth', 'fifth', 'sixth', 'seventh']
for l, s in zip(CS1.levels, strs):
    fmt[l] = s

# Label every other level using strings
ax1.clabel(CS1, CS1.levels[::2], fmt=fmt, fontsize=10)
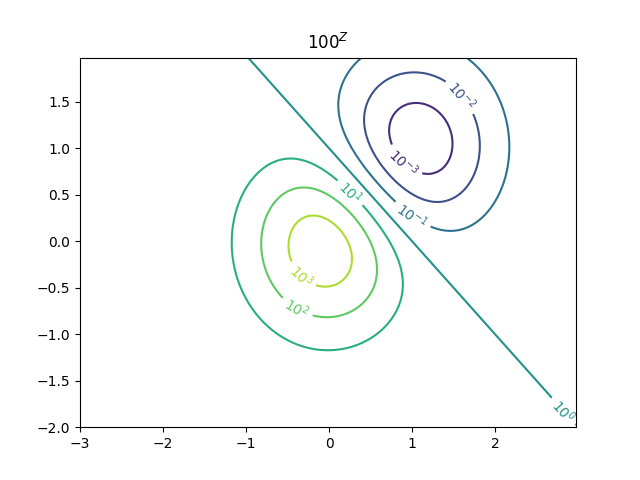
使用 Formatter
fig2, ax2 = plt.subplots()

CS2 = ax2.contour(X, Y, 100**Z, locator=plt.LogLocator())
fmt = ticker.LogFormatterMathtext()
fmt.create_dummy_axis()
ax2.clabel(CS2, CS2.levels, fmt=fmt)
ax2.set_title("$100^Z$")

plt.show()
参考
以下函数,方法,类和模块的用法在本例中显示:
matplotlib.axes.Axes.contour/matplotlib.pyplot.contourmatplotlib.axes.Axes.clabel/matplotlib.pyplot.clabelmatplotlib.ticker.LogFormatterMathtextmatplotlib.ticker.TickHelper.create_dummy_axis