备注
Go to the end 下载完整的示例代码.
茎图#
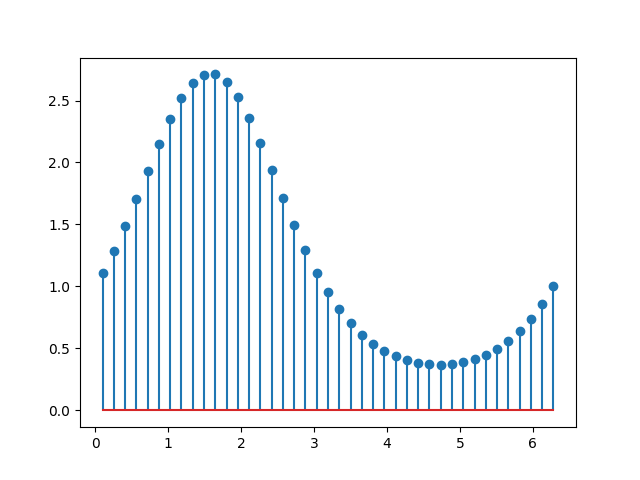
stem 绘制从 baseline 到 y 坐标的垂直线,并在尖端放置一个标记.
import matplotlib.pyplot as plt
import numpy as np

x = np.linspace(0.1, 2 * np.pi, 41)
y = np.exp(np.sin(x))

plt.stem(x, y)
plt.show()
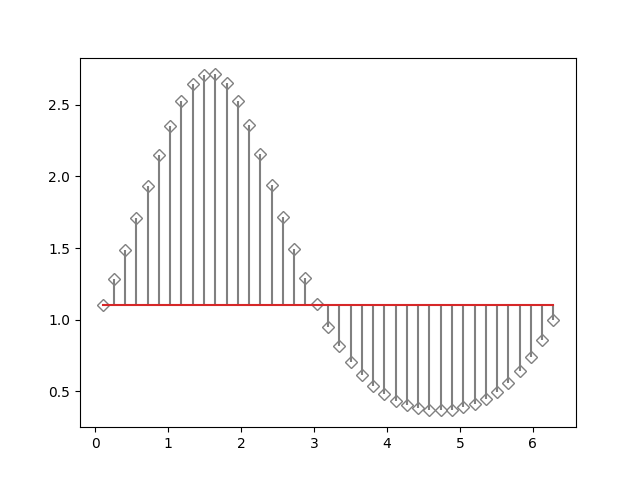
可以使用 bottom 调整 baseline 的位置.参数 linefmt,markerfmt 和 basefmt 控制绘图的基本格式属性.但是,与 plot 相比,并非所有属性都可以通过关键字参数配置.对于更高级的控制,请调整 pyplot 返回的线条对象.
markerline, stemlines, baseline = plt.stem(
    x, y, linefmt='grey', markerfmt='D', bottom=1.1)
markerline.set_markerfacecolor('none')
plt.show()
参考
以下函数,方法,类和模块的用法在本例中显示:
matplotlib.axes.Axes.stem/matplotlib.pyplot.stem