备注
Go to the end 下载完整的示例代码...
使用 LineCollection 绘制多条线#
Matplotlib 可以使用 LineCollection 有效地一次绘制多条线.
import matplotlib.pyplot as plt
import numpy as np
from matplotlib.collections import LineCollection
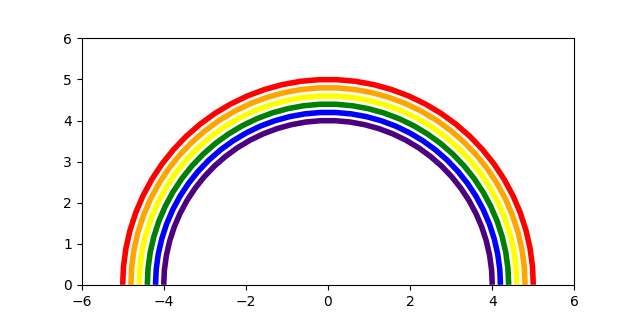
colors = ["indigo", "blue", "green", "yellow", "orange", "red"]
# create a list of half-circles with varying radii
theta = np.linspace(0, np.pi, 36)
radii = np.linspace(4, 5, num=len(colors))
arcs = [np.column_stack([r * np.cos(theta), r * np.sin(theta)]) for r in radii]
fig, ax = plt.subplots(figsize=(6.4, 3.2))
# set axes limits manually because Collections do not take part in autoscaling
ax.set_xlim(-6, 6)
ax.set_ylim(0, 6)
ax.set_aspect("equal") # to make the arcs look circular
# create a LineCollection with the half-circles
# its properties can be set per line by passing a sequence (here used for *colors*)
# or they can be set for all lines by passing a scalar (here used for *linewidths*)
line_collection = LineCollection(arcs, colors=colors, linewidths=4)
ax.add_collection(line_collection)
plt.show()
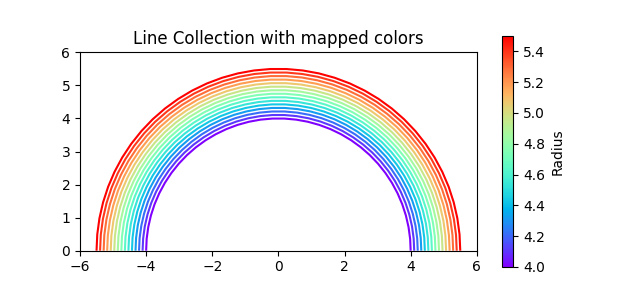
除了传递颜色列表( colors=colors )之外,我们还可以使用颜色映射.然后,这些线条根据传递给数组参数的附加值数组进行颜色编码.在下面的示例中,我们通过传递 array=radii 基于其半径对线进行着色.
num_arcs = 15
theta = np.linspace(0, np.pi, 36)
radii = np.linspace(4, 5.5, num=num_arcs)
arcs = [np.column_stack([r * np.cos(theta), r * np.sin(theta)]) for r in radii]

fig, ax = plt.subplots(figsize=(6.4, 3))
# set axes limits manually because Collections do not take part in autoscaling
ax.set_xlim(-6, 6)
ax.set_ylim(0, 6)
ax.set_aspect("equal")  # to make the arcs look circular

# create a LineCollection with the half-circles and color mapping
line_collection = LineCollection(arcs, array=radii, cmap="rainbow")
ax.add_collection(line_collection)

fig.colorbar(line_collection, label="Radius")
ax.set_title("Line Collection with mapped colors")

plt.show()
参考
以下函数,方法,类和模块的用法在本例中显示:
matplotlib.collections.LineCollectionmatplotlib.collections.Collection.set_arraymatplotlib.axes.Axes.add_collectionmatplotlib.figure.Figure.colorbar/matplotlib.pyplot.colorbar