备注
Go to the end 下载完整的示例代码.
使用矩形和 PolyCollections 构建直方图#
使用路径补丁绘制矩形.
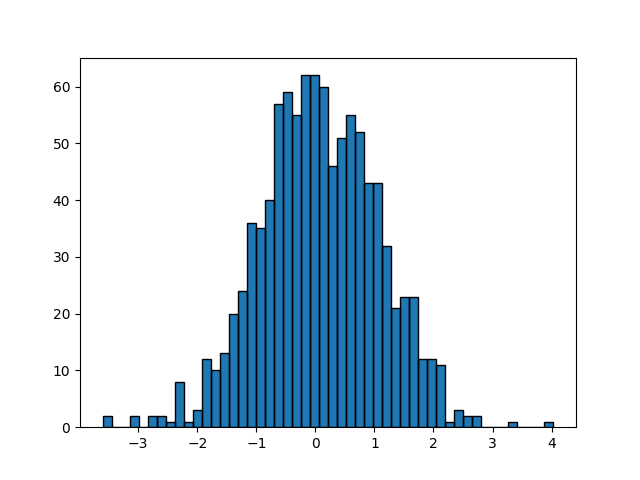
在使用 Matplotlib 中具有适当的路径(带有 moveto,lineto,closepoly 等)之前,实现了使用大量 Rectangle 实例或使用 PolyCollection 的更快方法.现在我们有了它们,我们可以使用 PathCollection 更有效地绘制具有同质属性的规则形状的对象集合.此示例创建了一个直方图--一开始设置顶点数组需要做更多的工作,但对于大量的对象来说,它应该更快.
import matplotlib.pyplot as plt
import numpy as np

import matplotlib.patches as patches
import matplotlib.path as path

np.random.seed(19680801)  # Fixing random state for reproducibility

# histogram our data with numpy
data = np.random.randn(1000)
n, bins = np.histogram(data, 50)

# get the corners of the rectangles for the histogram
left = bins[:-1]
right = bins[1:]
bottom = np.zeros(len(left))
top = bottom + n

# we need a (numrects x numsides x 2) numpy array for the path helper
# function to build a compound path
XY = np.array([[left, left, right, right], [bottom, top, top, bottom]]).T

# get the Path object
barpath = path.Path.make_compound_path_from_polys(XY)

# make a patch out of it, don't add a margin at y=0
patch = patches.PathPatch(barpath)
patch.sticky_edges.y[:] = [0]

fig, ax = plt.subplots()
ax.add_patch(patch)
ax.autoscale_view()
plt.show()

除了创建一个三维数组并使用 make_compound_path_from_polys ,我们也可以直接使用顶点和代码创建复合路径,如下所示
nrects = len(left)
nverts = nrects*(1+3+1)
verts = np.zeros((nverts, 2))
codes = np.ones(nverts, int) * path.Path.LINETO
codes[0::5] = path.Path.MOVETO
codes[4::5] = path.Path.CLOSEPOLY
verts[0::5, 0] = left
verts[0::5, 1] = bottom
verts[1::5, 0] = left
verts[1::5, 1] = top
verts[2::5, 0] = right
verts[2::5, 1] = top
verts[3::5, 0] = right
verts[3::5, 1] = bottom

barpath = path.Path(verts, codes)

# make a patch out of it, don't add a margin at y=0
patch = patches.PathPatch(barpath)
patch.sticky_edges.y[:] = [0]

fig, ax = plt.subplots()
ax.add_patch(patch)
ax.autoscale_view()
plt.show()
参考
以下函数,方法,类和模块的用法在本例中显示:
matplotlib.patchesmatplotlib.patches.PathPatchmatplotlib.pathmatplotlib.path.Pathmatplotlib.path.Path.make_compound_path_from_polysmatplotlib.axes.Axes.add_patchmatplotlib.collections.PathCollection
此示例展示的替代方案是
matplotlib.collections.PolyCollectionmatplotlib.axes.Axes.hist