备注
Go to the end 下载完整的示例代码.
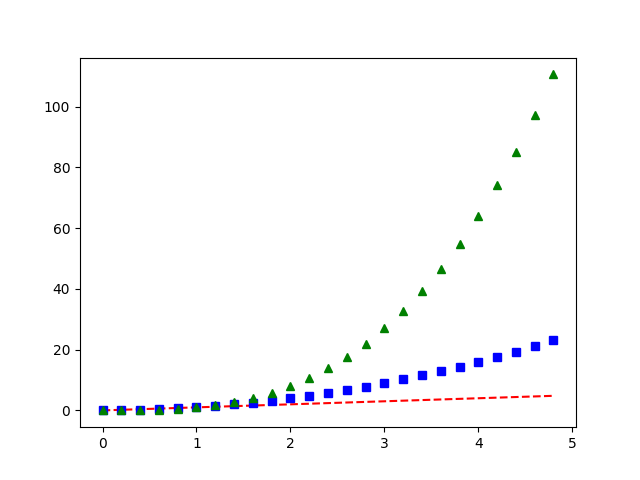
使用 pyplot 绘制多条线#
使用单个 pyplot.plot 调用绘制三个数据集.
import matplotlib.pyplot as plt
import numpy as np

# evenly sampled time at 200ms intervals
t = np.arange(0., 5., 0.2)

# red dashes, blue squares and green triangles
plt.plot(t, t, 'r--', t, t**2, 'bs', t, t**3, 'g^')
plt.show()
参考
以下函数,方法,类和模块的用法在本例中显示:
matplotlib.axes.Axes.plot/matplotlib.pyplot.plot