备注
Go to the end 下载完整的示例代码.
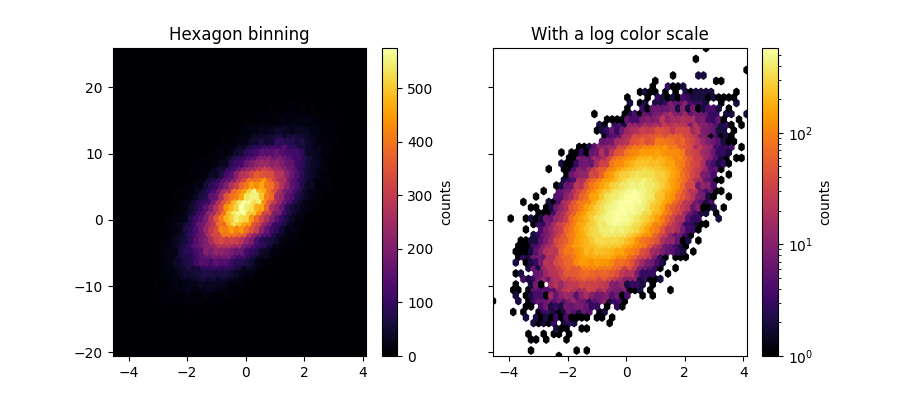
六边形分箱图#
hexbin 是一个 2D 直方图,其中 bin 是六边形,颜色表示每个 bin 中数据点的数量.
import matplotlib.pyplot as plt
import numpy as np

# Fixing random state for reproducibility
np.random.seed(19680801)

n = 100_000
x = np.random.standard_normal(n)
y = 2.0 + 3.0 * x + 4.0 * np.random.standard_normal(n)
xlim = x.min(), x.max()
ylim = y.min(), y.max()

fig, (ax0, ax1) = plt.subplots(ncols=2, sharey=True, figsize=(9, 4))

hb = ax0.hexbin(x, y, gridsize=50, cmap='inferno')
ax0.set(xlim=xlim, ylim=ylim)
ax0.set_title("Hexagon binning")
cb = fig.colorbar(hb, ax=ax0, label='counts')

hb = ax1.hexbin(x, y, gridsize=50, bins='log', cmap='inferno')
ax1.set(xlim=xlim, ylim=ylim)
ax1.set_title("With a log color scale")
cb = fig.colorbar(hb, ax=ax1, label='counts')

plt.show()
参考
以下函数,方法,类和模块的用法在本例中显示:
matplotlib.axes.Axes.hexbin/matplotlib.pyplot.hexbin