备注
Go to the end to download the full example code..
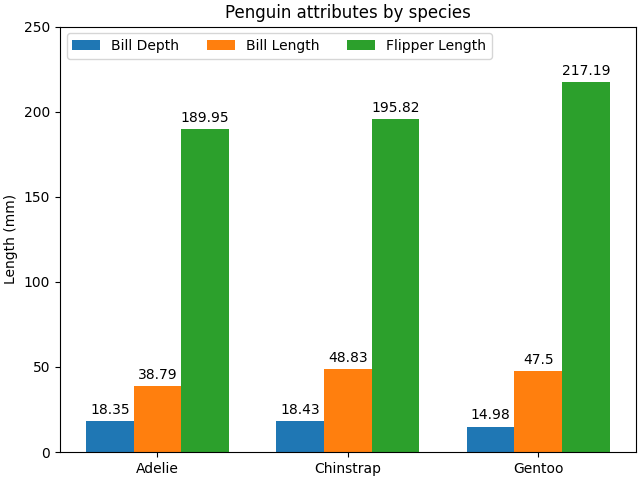
带有标签的分组柱状图#
此示例展示了如何创建分组柱状图以及如何使用标签注释柱状图.
# data from https://allisonhorst.github.io/palmerpenguins/

import matplotlib.pyplot as plt
import numpy as np

species = ("Adelie", "Chinstrap", "Gentoo")
penguin_means = {
    'Bill Depth': (18.35, 18.43, 14.98),
    'Bill Length': (38.79, 48.83, 47.50),
    'Flipper Length': (189.95, 195.82, 217.19),
}

x = np.arange(len(species))  # the label locations
width = 0.25  # the width of the bars
multiplier = 0

fig, ax = plt.subplots(layout='constrained')

for attribute, measurement in penguin_means.items():
    offset = width * multiplier
    rects = ax.bar(x + offset, measurement, width, label=attribute)
    ax.bar_label(rects, padding=3)
    multiplier += 1

# Add some text for labels, title and custom x-axis tick labels, etc.
ax.set_ylabel('Length (mm)')
ax.set_title('Penguin attributes by species')
ax.set_xticks(x + width, species)
ax.legend(loc='upper left', ncols=3)
ax.set_ylim(0, 250)

plt.show()
参考
以下函数,方法,类和模块的用法在本例中显示:
matplotlib.axes.Axes.bar/matplotlib.pyplot.barmatplotlib.axes.Axes.bar_label/matplotlib.pyplot.bar_label