备注
Go to the end 下载完整的示例代码.
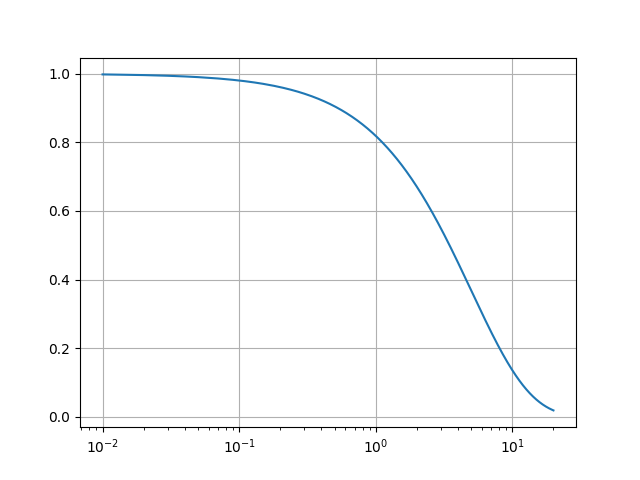
对数轴#
这是一个使用 semilogx 为 x 轴分配对数刻度的示例.
import matplotlib.pyplot as plt
import numpy as np

fig, ax = plt.subplots()

dt = 0.01
t = np.arange(dt, 20.0, dt)

ax.semilogx(t, np.exp(-t / 5.0))
ax.grid()

plt.show()
备注
Go to the end 下载完整的示例代码.
这是一个使用 semilogx 为 x 轴分配对数刻度的示例.
import matplotlib.pyplot as plt
import numpy as np
fig, ax = plt.subplots()
dt = 0.01
t = np.arange(dt, 20.0, dt)
ax.semilogx(t, np.exp(-t / 5.0))
ax.grid()
plt.show()